12
\$\begingroup\$

In probability theory, the normal (or Gaussian) distribution is a very common continuous probability distribution. Normal distributions are important in statistics and are often used in the natural and social sciences to represent real-valued random variables whose distributions are not known.

The challenge

Your challenge is to plot the probability density of the Gaussian Distribution on a 3-dimensional plane. This function is defined as:

Where:


A = 1, σx = σy = σ

Rules

  • Your program must take one input σ, the standard deviation.
  • Your program must print a 3D plot of the Gaussian Distribution in the highest quality as your language/system allows.
  • Your program may not use a direct Gaussian Distribution or probability density builtin.
  • Your program does not have to terminate.
  • Your plot may be in black and white or color.
  • Your plot must have grid lines on the bottom. Grid lines on the sides (as shown in the examples) are unnecessary.
  • Your plot does not need to have line numbers next to the grid lines.

Scoring

As usual in , the submission with the least bytes wins! I may never "accept" an answer using the button, unless one is incredibly small and intuitive.

Example output

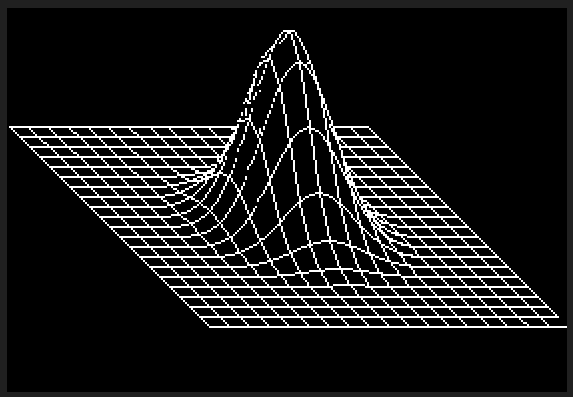
Your output could look something like this:

5

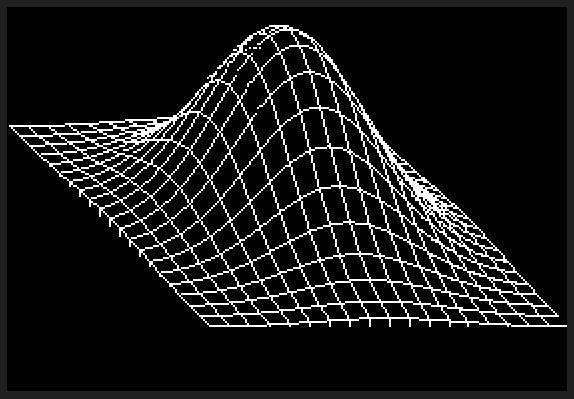
Or it could look like this:

6

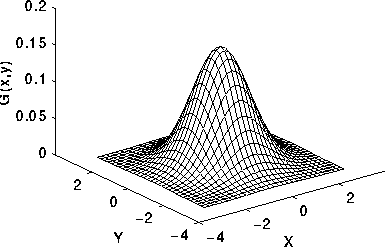
More valid outputs. Invalid outputs.

\$\endgroup\$
14
  • \$\begingroup\$ I was confused that you just showed the function for the X-axis. Do we need to take separate input/outputs for the X and Y sigma and mu's? \$\endgroup\$ Commented May 27, 2017 at 2:00
  • \$\begingroup\$ So are we to assume that μ equals 0? And what scale do you require for x and y? If the x-and y-ranges are chosen very small relative to σ, then the graph will essentially look like a constant function. \$\endgroup\$ Commented May 27, 2017 at 2:32
  • \$\begingroup\$ (For the two-dimensional distribution, I think it is clearer if you use |x-μ|^2 in the definition rather than (x-μ)^2.) \$\endgroup\$ Commented May 27, 2017 at 2:33
  • \$\begingroup\$ @GregMartin Edited. \$\endgroup\$
    – MD XF
    Commented May 27, 2017 at 3:03
  • 2
    \$\begingroup\$ Still not clear ... what are x_o and y_o and θ? \$\endgroup\$ Commented May 27, 2017 at 4:28

5 Answers 5

16
\$\begingroup\$

C++, 3477 3344 bytes

Byte count does not include the unnecessary newlines.
MD XF golfed off 133 bytes.

There's no way C++ can compete for this, but I thought it would be fun to write a software renderer for the challenge. I tore out and golfed some chunks of GLM for the 3D math and used Xiaolin Wu's line algorithm for rasterization. The program outputs the result to a PGM file named g.
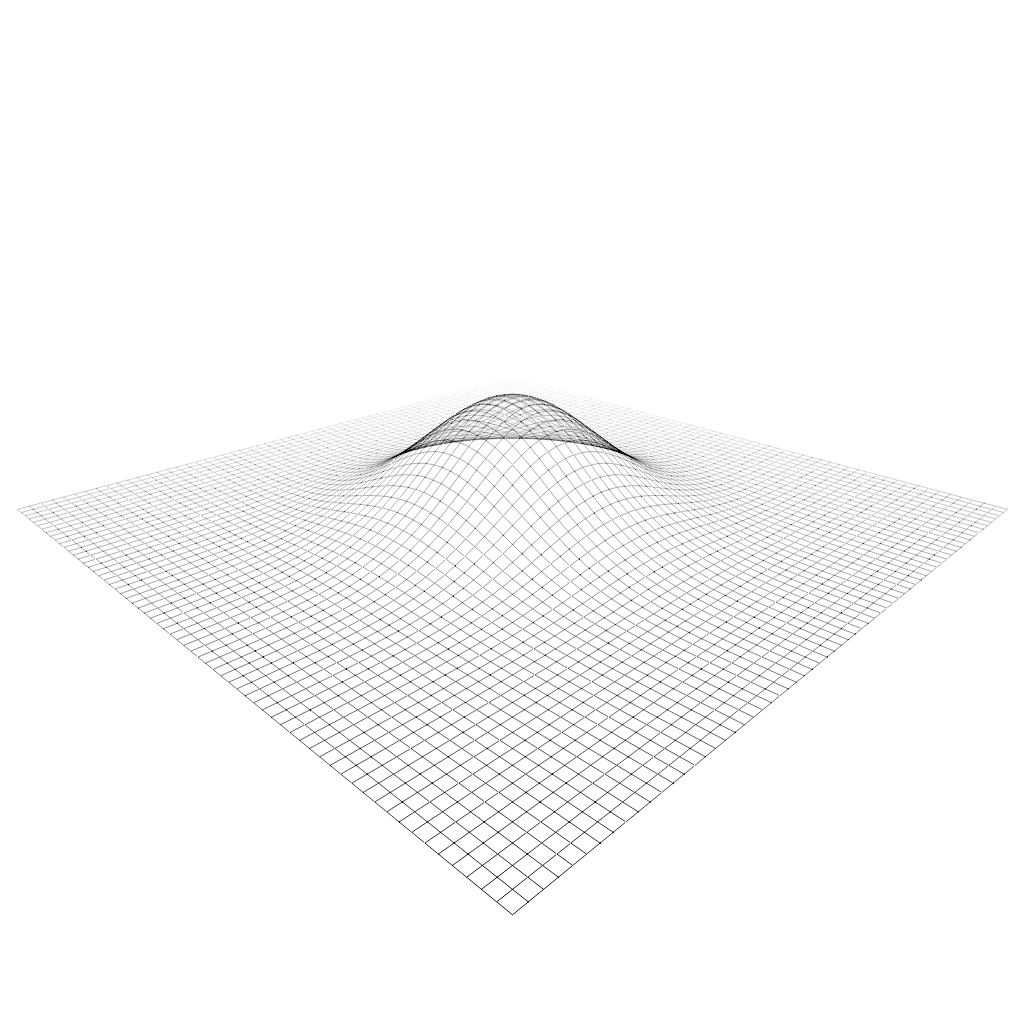
Output

#include<array>
#include<cmath>
#include<vector>
#include<string>
#include<fstream>
#include<algorithm>
#include<functional>
#define L for
#define A auto
#define E swap
#define F float
#define U using
U namespace std;
#define K vector
#define N <<"\n"
#define Z size_t
#define R return
#define B uint8_t
#define I uint32_t
#define P operator
#define W(V)<<V<<' '
#define Y template<Z C>
#define G(O)Y vc<C>P O(vc<C>v,F s){vc<C>o;L(Z i=0;i<C;++i){o\
[i]=v[i]O s;}R o;}Y vc<C>P O(vc<C>l, vc<C>r){vc<C>o;L(Z i=0;i<C;++i){o[i]=l[i]O r[i];}R o;}
Y U vc=array<F,C>;U v2=vc<2>;U v3=vc<3>;U v4=vc<4>;U m4=array<v4,4>;G(+)G(-)G(*)G(/)Y F d(
vc<C>a,vc<C>b){F o=0;L(Z i=0;i<C;++i){o+=a[i]*b[i];}R o;}Y vc<C>n(vc<C>v){R v/sqrt(d(v,v));
}v3 cr(v3 a,v3 b){R v3{a[1]*b[2]-b[1]*a[2],a[2]*b[0]-b[2]*a[0],a[0]*b[1]-b[0]*a[1]};}m4 P*(
m4 l,m4 r){R{l[0]*r[0][0]+l[1]*r[0][1]+l[2]*r[0][2]+l[3]*r[0][3],l[0]*r[1][0]+l[1]*r[1][1]+
l[2]*r[1][2]+l[3]*r[1][3],l[0]*r[2][0]+l[1]*r[2][1]+l[2]*r[2][2]+l[3]*r[2][3],l[0]*r[3][0]+
l[1]*r[3][1]+l[2]*r[3][2]+l[3]*r[3][3]};}v4 P*(m4 m,v4 v){R v4{m[0][0]*v[0]+m[1][0]*v[1]+m[
2][0]*v[2]+m[3][0]*v[3],m[0][1]*v[0]+m[1][1]*v[1]+m[2][1]*v[2]+m[3][1]*v[3],m[0][2]*v[0]+m[
1][2]*v[1]+m[2][2]*v[2]+m[3][2]*v[3],m[0][3]*v[0]+m[1][3]*v[1]+m[2][3]*v[2]+m[3][3]*v[3]};}
m4 at(v3 a,v3 b,v3 c){A f=n(b-a);A s=n(cr(f,c));A u=cr(s,f);A o=m4{1,0,0,0,0,1,0,0,0,0,1,0,
0,0,0,1};o[0][0]=s[0];o[1][0]=s[1];o[2][0]=s[2];o[0][1]=u[0];o[1][1]=u[1];o[2][1]=u[2];o[0]
[2]=-f[0];o[1][2]=-f[1];o[2][2]=-f[2];o[3][0]=-d(s,a);o[3][1]=-d(u,a);o[3][2]=d(f,a);R o;}
m4 pr(F f,F a,F b,F c){F t=tan(f*.5f);m4 o{};o[0][0]=1.f/(t*a);o[1][1]=1.f/t;o[2][3]=-1;o[2
][2]=c/(b-c);o[3][2]=-(c*b)/(c-b);R o;}F lr(F a,F b,F t){R fma(t,b,fma(-t,a,a));}F fp(F f){
R f<0?1-(f-floor(f)):f-floor(f);}F rf(F f){R 1-fp(f);}struct S{I w,h; K<F> f;S(I w,I h):w{w
},h{h},f(w*h){}F&P[](pair<I,I>c){static F z;z=0;Z i=c.first*w+c.second;R i<f.size()?f[i]:z;
}F*b(){R f.data();}Y vc<C>n(vc<C>v){v[0]=lr((F)w*.5f,(F)w,v[0]);v[1]=lr((F)h*.5f,(F)h,-v[1]
);R v;}};I xe(S&f,v2 v,bool s,F g,F c,F*q=0){I p=(I)round(v[0]);A ye=v[1]+g*(p-v[0]);A xd=
rf(v[0]+.5f);A x=p;A y=(I)ye;(s?f[{y,x}]:f[{x,y}])+=(rf(ye)*xd)*c;(s?f[{y+1,x}]:f[{x,y+1}])
+=(fp(ye)*xd)*c;if(q){*q=ye+g;}R x;}K<v4> g(F i,I r,function<v4(F,F)>f){K<v4>g;F p=i*.5f;F
q=1.f/r;L(Z zi=0;zi<r;++zi){F z=lr(-p,p,zi*q);L(Z h=0;h<r;++h){F x=lr(-p,p,h*q);g.push_back
(f(x,z));}}R g;}B xw(S&f,v2 b,v2 e,F c){E(b[0],b[1]);E(e[0],e[1]);A s=abs(e[1]-b[1])>abs
(e[0]-b[0]);if(s){E(b[0],b[1]);E(e[0],e[1]);}if(b[0]>e[0]){E(b[0],e[0]);E(b[1],e[1]);}F yi=
0;A d=e-b;A g=d[0]?d[1]/d[0]:1;A xB=xe(f,b,s,g,c,&yi);A xE=xe(f,e,s,g,c);L(I x=xB+1;x<xE;++
x){(s?f[{(I)yi,x}]:f[{x,(I)yi}])+=rf(yi)*c;(s?f[{(I)yi+1,x}]:f[{x,(I)yi+1}])+=fp(yi)*c;yi+=
g;}}v4 tp(S&s,m4 m,v4 v){v=m*v;R s.n(v/v[3]);}main(){F l=6;Z c=64;A J=g(l,c,[](F x,F z){R
v4{x,exp(-(pow(x,2)+pow(z,2))/(2*pow(0.75f,2))),z,1};});I w=1024;I h=w;S s(w,h);m4 m=pr(
1.0472f,(F)w/(F)h,3.5f,11.4f)*at({4.8f,3,4.8f},{0,0,0},{0,1,0});L(Z j=0;j<c;++j){L(Z i=0;i<
c;++i){Z id=j*c+i;A p=tp(s,m,J[id]);A dp=[&](Z o){A e=tp(s,m,J[id+o]);F v=(p[2]+e[2])*0.5f;
xw(s,{p[0],p[1]},{e[0],e[1]},1.f-v);};if(i<c-1){dp(1);}if(j<c-1){dp(c);}}}K<B> b(w*h);L(Z i
=0;i<b.size();++i){b[i]=(B)round((1-min(max(s.b()[i],0.f),1.f))*255);}ofstream f("g");f 
W("P2")N;f W(w)W(h)N;f W(255)N;L(I y=0;y<h;++y){L(I x=0;x<w;++x)f W((I)b[y*w+x]);f N;}R 0;}
  • l is the length of one side of the grid in world space.
  • c is the number of vertices along each edge of the grid.
  • The function that creates the grid is called with a function that takes two inputs, the x and z (+y goes up) world space coordinates of the vertex, and returns the world space position of the vertex.
  • w is the width of the pgm
  • h is the height of the pgm
  • m is the view/projection matrix. The arguments used to create m are...
    • field of view in radians
    • aspect ratio of the pgm
    • near clip plane
    • far clip plane
    • camera position
    • camera target
    • up vector

The renderer could easily have more features, better performance, and be better golfed, but I've had my fun!

\$\endgroup\$
8
  • 2
    \$\begingroup\$ Wow, that is incredible! \$\endgroup\$
    – MD XF
    Commented May 29, 2017 at 3:56
  • 1
    \$\begingroup\$ Not at all...go for it! \$\endgroup\$ Commented Jun 4, 2017 at 20:33
  • 1
    \$\begingroup\$ There you go, 133 bytes off! \$\endgroup\$
    – MD XF
    Commented Jun 4, 2017 at 21:13
  • 1
    \$\begingroup\$ This is terrific ! If you could tell me where you learnt all of that, that would be great ! \$\endgroup\$ Commented Aug 1, 2017 at 22:00
  • 1
    \$\begingroup\$ @HatsuPointerKun Glad you enjoy it! This tutorial... opengl-tutorial.org/beginners-tutorials/tutorial-3-matrices ...is a great place to start. \$\endgroup\$ Commented Aug 2, 2017 at 2:23
10
\$\begingroup\$

Mathematica, 47 bytes

Plot3D[E^(-(x^2+y^2)/2/#^2),{x,-6,6},{y,-6,6}]&

takes as input σ

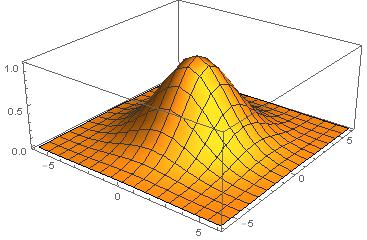
Input

[2]

output
enter image description here

-2 bytes thanks to LLlAMnYP

\$\endgroup\$
2
  • 1
    \$\begingroup\$ Mathematica winning? No surprises there :P \$\endgroup\$
    – MD XF
    Commented May 28, 2017 at 0:50
  • 3
    \$\begingroup\$ Saving 2 bytes with E^(-(x^2+y^2)/2/#^2) \$\endgroup\$
    – LLlAMnYP
    Commented May 29, 2017 at 7:54
7
\$\begingroup\$

Gnuplot 4, 64 62 61 60 47 bytes

(Tied with Mathematica! WooHoo!)

se t pn;se is 80;sp exp(-(x**2+y**2)/(2*$0**2))

Save the above code into a file named A.gp and invoke it with the following:

gnuplot -e 'call "A.gp" $1'>GnuPlot3D.png

where the $1 is to be replaced with the value of σ. This will save a .png file named GnuPlot3D.png containing the desired output into the current working directory.

Note that this only works with distributions of Gnuplot 4 since in Gnuplot 5 the $n references to arguments were deprecated and replaced with the unfortunately more verbose ARGn.

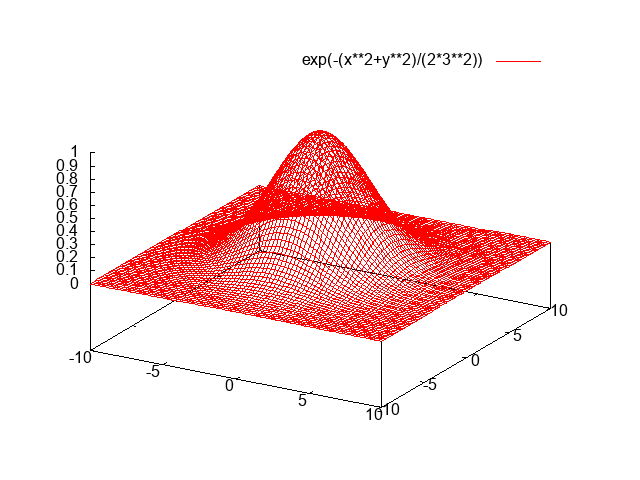
Sample output with σ = 3:

Sample Output

This output is fine according to OP.


Gnuplot 4, Alternate Solution, 60 bytes

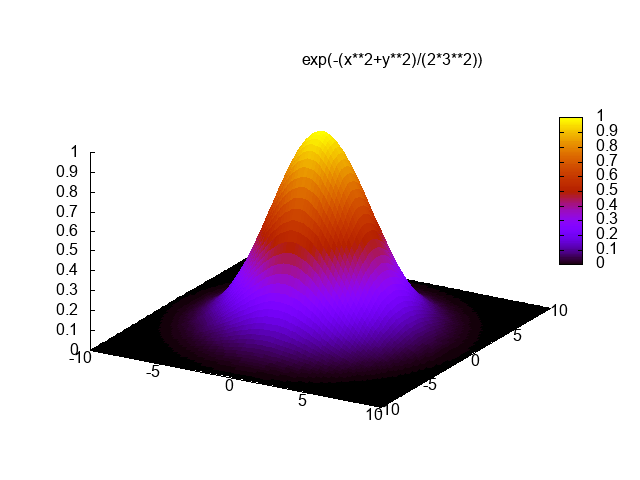
Here is an alternate solution which is much longer than the previous one but the output looks much better in my opinion.

se t pn;se is 80;se xyp 0;sp exp(-(x**2+y**2)/(2*$0**2))w pm

This still requires Gnuplot 4 for the same reason as the previous solution.

Sample output with σ = 3:

Sample Output # 2

\$\endgroup\$
7
  • \$\begingroup\$ I am not sure if it molds to the specifications required what specifications do you think it does not meet? \$\endgroup\$
    – MD XF
    Commented May 29, 2017 at 0:27
  • \$\begingroup\$ @MDXF Firstly, I am not sure if the transparency of the graph is okay. I honestly don't really like it, which is why I was not sure if it would be okay here. Secondly, the graph begins one unit high from the bottom by default, and I am not sure if that is all right either. Thirdly, because the graph begins one unit high, I am not sure the disproportionality of the graph compared to the graphs given in the original post is all right. However, if this is all okay with you, I will happily make it the main answer. \$\endgroup\$
    – R. Kap
    Commented May 29, 2017 at 6:23
  • \$\begingroup\$ @MDXF In fact, I was going to post it as the original answer, but for these reasons I chose not to and posted by current answer instead. \$\endgroup\$
    – R. Kap
    Commented May 29, 2017 at 6:24
  • \$\begingroup\$ @MDXF Actually, I can make it even shorter if this is okay. I understand if it won't be, but it does not hurt to ask. It is the default way Gnuplot would plot the probability density of the Gaussian distribution with a Sigma of 2 without any environment modifications. \$\endgroup\$
    – R. Kap
    Commented May 29, 2017 at 6:33
  • \$\begingroup\$ @MDXF I guess I could have asked before posting my original answer, but at the time I was very eager to post an answer. \$\endgroup\$
    – R. Kap
    Commented May 29, 2017 at 9:06
7
\$\begingroup\$

R, 105 102 87 86 bytes

s=scan();plot3D::persp3D(z=sapply(x<-seq(-6,6,.1),function(y)exp(-(y^2+x^2)/(2*s^2))))

Takes Sigma from STDIN. Creates a vector from -6 to 6 in steps of .1 for both x and y, then creates an 121x121 matrix by taking the outer product of x and y. This is shorter than calling matrix and specifying the dimensions. The matrix is now already filled, but that's ok, because we are overwriting that.

The for-loop loops over the values in x, making use of the vectorized operations in R, creating the density matrix one row at a time.

(s)apply again is a shorter method for vectorized operations. Like the hero it is, it handles the creation of the matrix all by itself, saving quite a few bytes.

enter image description here

128 125 110 109 bytes, but way more fancy:

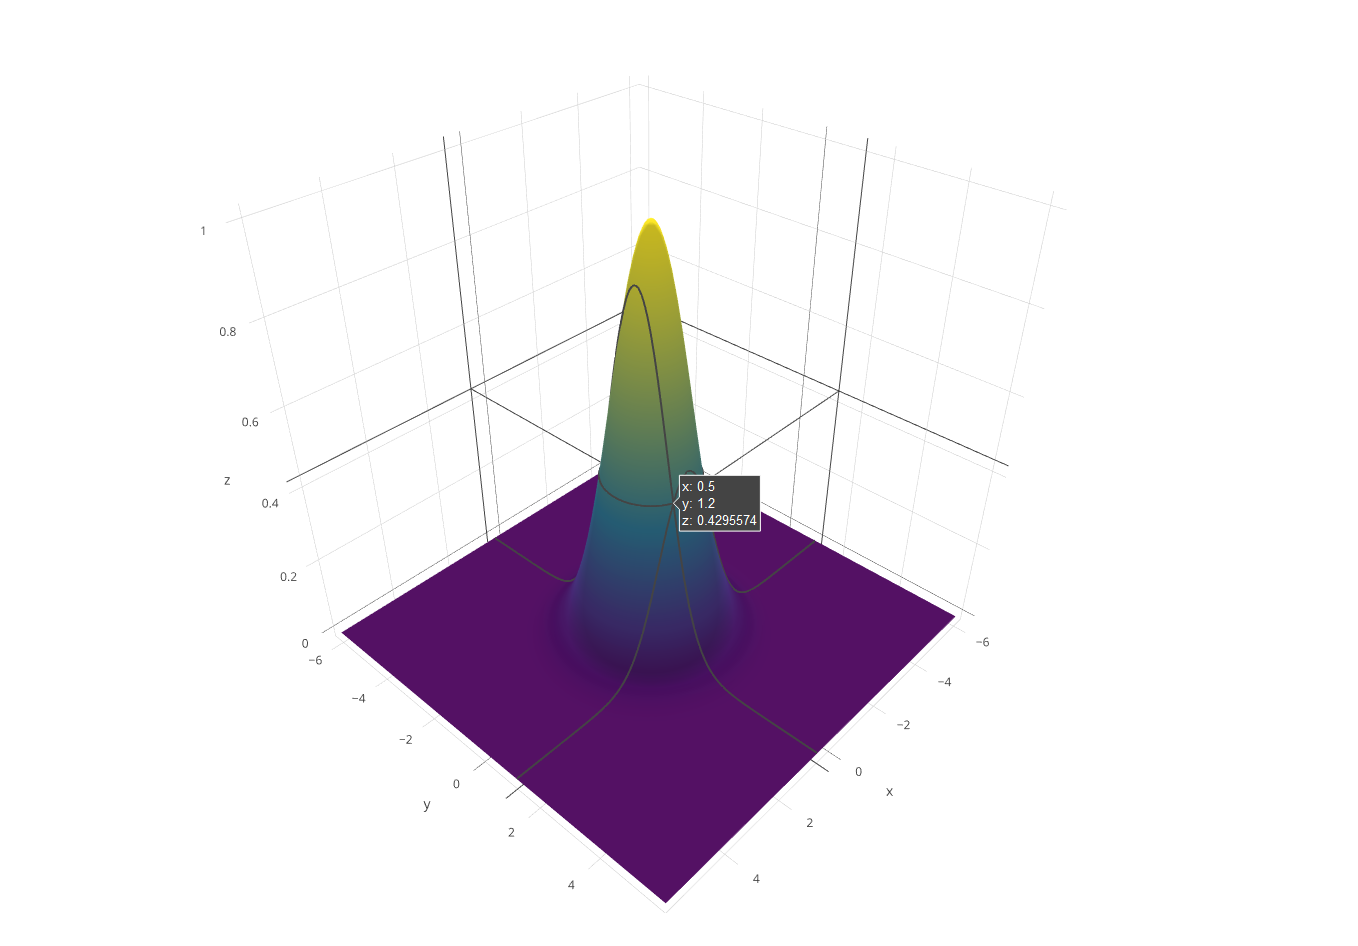
This plot is created by the plotly package. Sadly the specification is a bit wordy, so this costs a lot of bytes. The result is really really fancy though. I would highly recommend trying it out for yourself.

s=scan();plotly::plot_ly(z=sapply(x<-seq(-6,6,.1),function(y)exp(-(y^2+x^2)/(2*s^2))),x=x,y=x,type="surface")

bla

\$\endgroup\$
4
  • \$\begingroup\$ I specified in the question that the graph does not need to have line numbers, your second submission is fine. \$\endgroup\$
    – MD XF
    Commented May 27, 2017 at 14:13
  • \$\begingroup\$ Oh, I must've missed that. I swapped my solutions around. I think the plotly plot is fancy enough to warrant still being included here. \$\endgroup\$
    – JAD
    Commented May 27, 2017 at 15:46
  • \$\begingroup\$ Well, both are much, much fancier than mine :P \$\endgroup\$
    – MD XF
    Commented May 28, 2017 at 0:51
  • \$\begingroup\$ Since you only use s once, could you do 2*scan()^2 and remove the s=scan(); at the start? It would save 3 bytes. \$\endgroup\$
    – KSmarts
    Commented Sep 29, 2017 at 14:49
6
\$\begingroup\$

Applesoft BASIC, 930 783 782 727 719 702 695 637 bytes

-72 bytes and a working program thanks to ceilingcat spotting my error and a shortened algorithm

0TEXT:HOME:INPUTN:HGR:HCOLOR=3:W=279:H=159:L=W-100:Z=L/10:B=H-100:C=H-60:K=0.5:M=1/(2*3.14159265*N*N):FORI=0TO10STEPK:X=10*I+1:Y=10*I+B:HPLOTX,Y:FORJ=0TOL STEP1:O=10*J/L:D=ABS(5-I):E=ABS(5-O):R=(D*D+E*E)/(2*N*N):G=EXP(-R)*M:A=INT((C*G)/M):X=10*I+Z*O+1:Y=10*I+B-A:HPLOTTOX,Y:IF(I=0)GOTO4
1IF(J=L)GOTO3
2V=INT(J/10):IF((J/10)<>V)GOTO5
3D=ABS(5-I+K):E=ABS(5-O):R=(D*D+E*E)/(2*N*N):U=EXP(-R)/(2*3.14159*N*N):S=INT((C*U)/M):P=10*(I-K)+Z*O+1:Q=10*(I-K)+B-S:HPLOT TOP,Q:HPLOTX,Y
4IF(J=0)GOTO7:IF(I<10)GOTO5:IF(J=L)GOTO6:V=INT(J/10):IF((J/10)=V)GOTO6
5HCOLOR=0
6HPLOTTOX,10*I+B:HCOLOR=3:HPLOTX,Y
7NEXTJ:NEXTI:HPLOTW+1,H:HPLOTTO101,H:HPLOTTO0+1,H

Ungolfed version here.

When given input 1:

input-1

When given input 2:

input-2

\$\endgroup\$
2
  • 1
    \$\begingroup\$ This yet again shows the superiority of BASIC .... \$\endgroup\$
    – user9206
    Commented May 29, 2017 at 7:20
  • \$\begingroup\$ Can save a few more bytes by setting one or more variables to some frequently used value, such as 10. Also, suggest replacing EXP(X)/(2*3.14159*S1*S1) with EXP(X)*M \$\endgroup\$
    – ceilingcat
    Commented Jun 5, 2017 at 21:37

Your Answer

By clicking “Post Your Answer”, you agree to our terms of service and acknowledge you have read our privacy policy.

Not the answer you're looking for? Browse other questions tagged or ask your own question.