Gnuplot 4, 64 62 61 60 47 bytes
(Tied with Mathematica! WooHoo!)
se t pn;se is 80;sp exp(-(x**2+y**2)/(2*$0**2))
Save the above code into a file named A.gp and invoke it with the following:
gnuplot -e 'call "A.gp" $1'>GnuPlot3D.png
where the $1 is to be replaced with the value of σ. This will save a .png file named GnuPlot3D.png containing the desired output into the current working directory.
Note that this only works with distributions of Gnuplot 4 since in Gnuplot 5 the $n references to arguments were deprecated and replaced with the unfortunately more verbose ARGn.
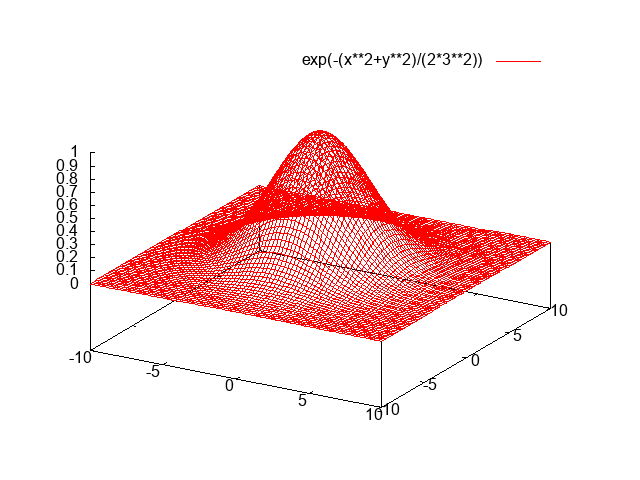
Sample output with σ = 3:
This output is fine according to OP.
Gnuplot 4, Alternate Solution, 60 bytes
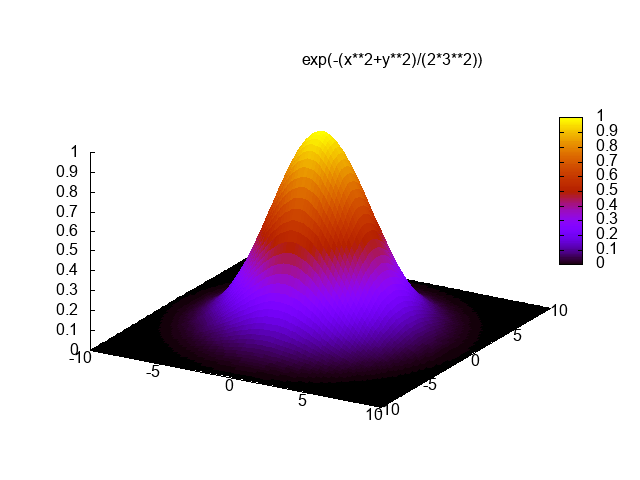
Here is an alternate solution which is much longer than the previous one but the output looks much better in my opinion.
se t pn;se is 80;se xyp 0;sp exp(-(x**2+y**2)/(2*$0**2))w pm
This still requires Gnuplot 4 for the same reason as the previous solution.
Sample output with σ = 3:


