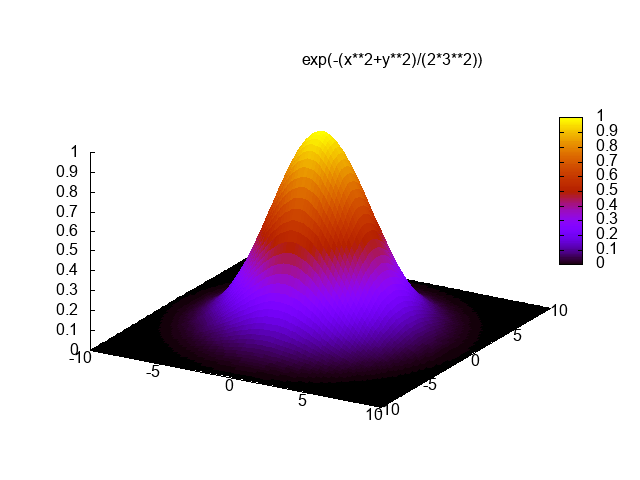
Gnuplot 4, 64 62 61 60 bytes
se t pn;se is 80;se xyp 0;sp exp(-(x**2+y**2)/(2*$0**2))w pm
Save the above code into a file named A.gp and invoke it with the following:
gnuplot -e 'call "A.gp" $1'>GnuPlot3D.png
where the $1 is to be replaced with the value of σ. This will save a .png file named GnuPlot3D.png containing the desired output into the current working directory.
Note that this only works with distributions of Gnuplot 4 since in Gnuplot 5 the $n references to arguments were deprecated and replaced with the unfortunately more verbose ARGn.
Sample output with σ = 3:
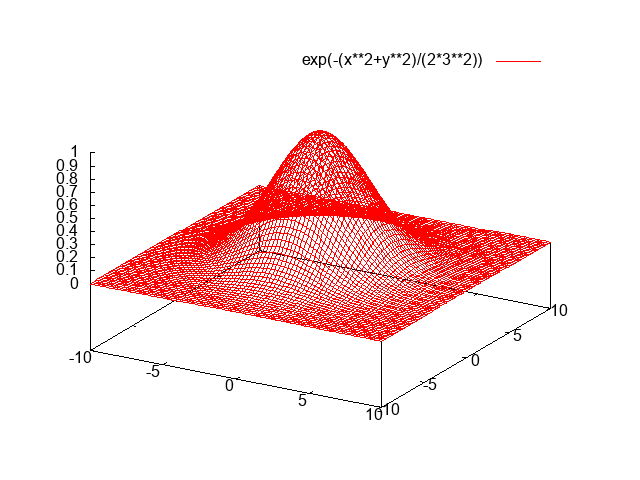
Here is another solution which is much shorter at 47 bytes than the previous one but not the main answer as I am not sure if it molds to the specifications required. Still, it does the main job of plotting the probability density of the Gaussian distribution in 3 dimensions, so it warrants being out here in my opinion.
se t pn;se is 80;sp exp(-(x**2+y**2)/(2*$0**2))
This still requires Gnuplot 4 for the same reason as the previous solution.
Sample output with σ = 3:


