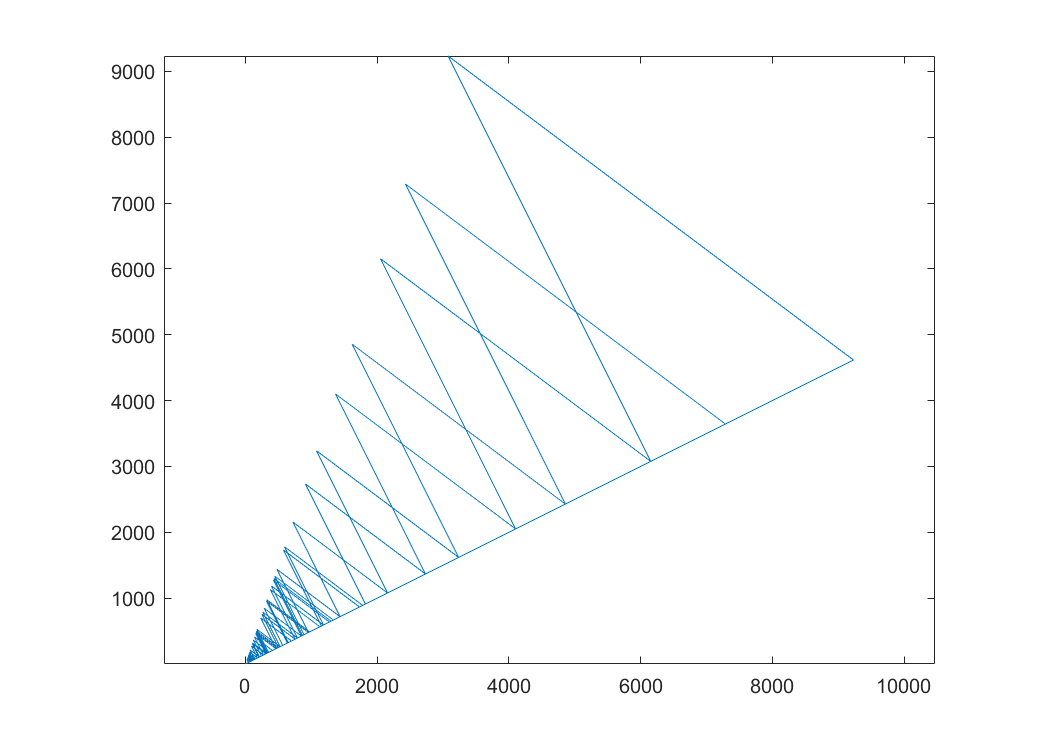
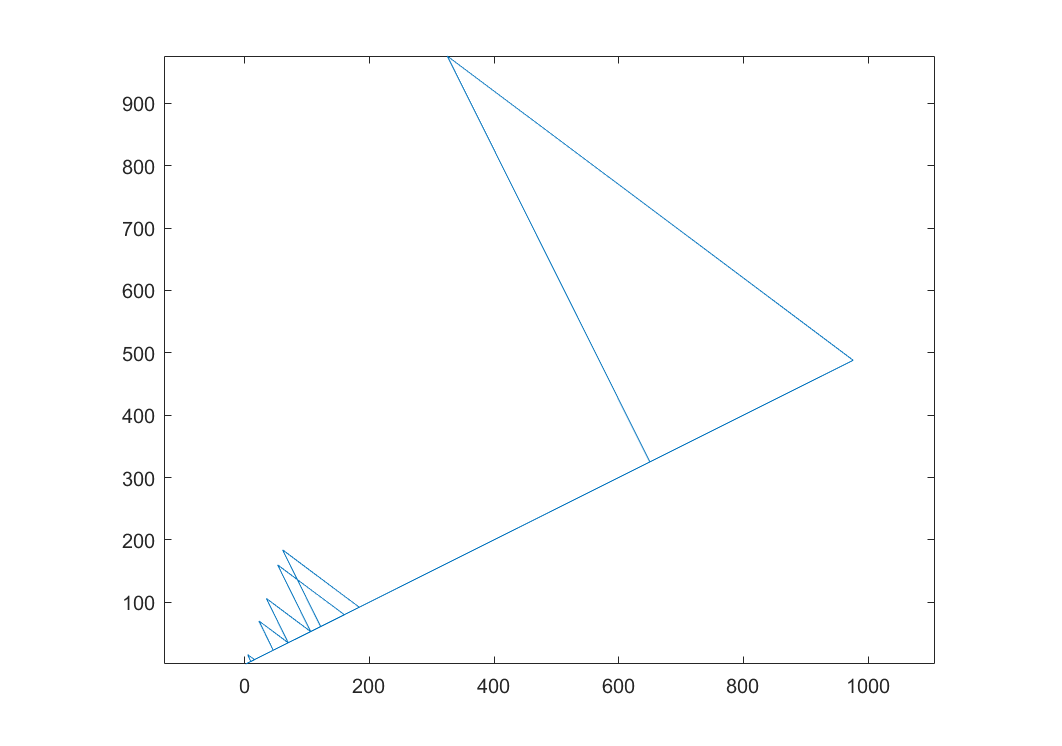
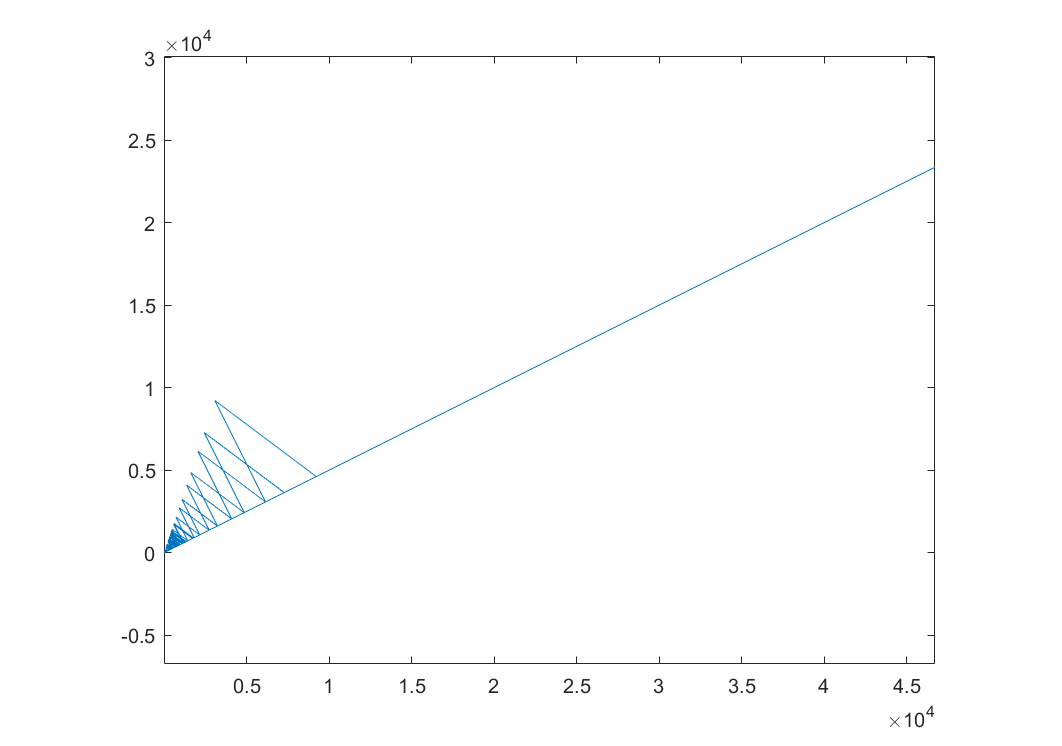
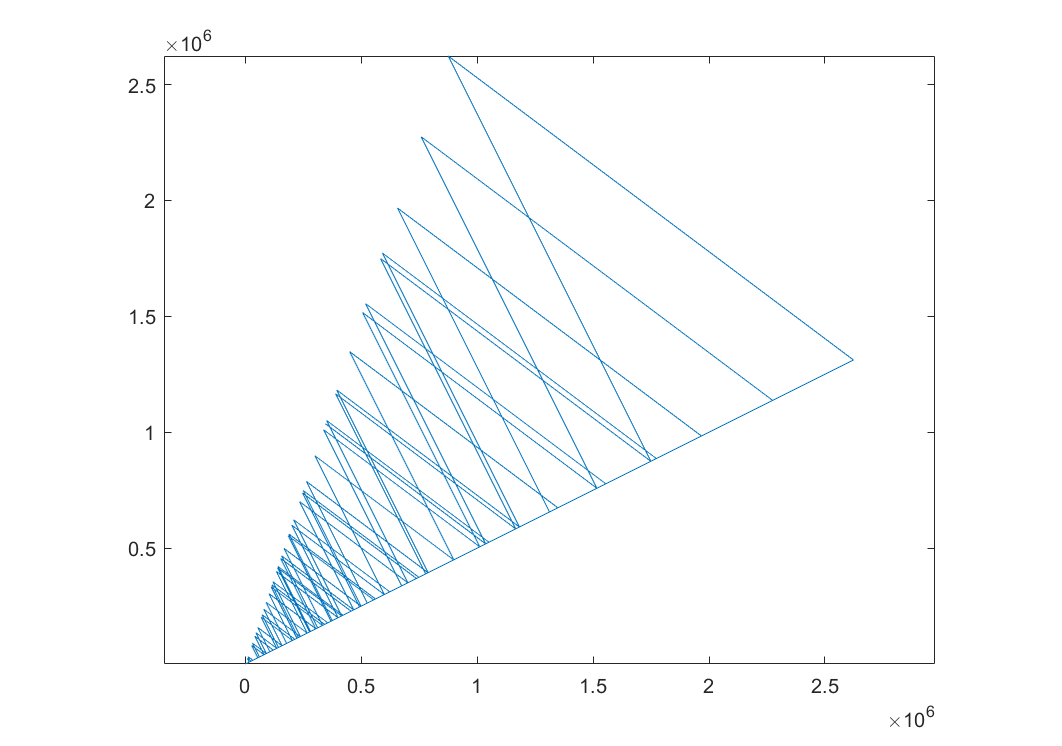
28
\$\begingroup\$

The Collatz sequence

Given a positive integer \$a_1\$, the Collatz sequence with starting value \$a_1\$ is defined as \begin{equation} a_{n+1} = \begin{cases} a_n/2 & \mathrm{if}\ a_n\ \mathrm{is}\ \mathrm{even} \\ 3a_n+1 & \mathrm{if}\ a_n\ \mathrm{is}\ \mathrm{odd}. \end{cases} \end{equation} It is conjectured that, for any starting value, this sequence always reaches the number \$1\$. This challenge assumes that the conjecture is true.

The challenge

Given an integer \$a_1 > 2\$, compute the Collatz sequence until \$1\$ is reached for the first time. Let \$N\$ be the number of sequence terms (including \$a_1\$ and \$a_N = 1\$). From the sequence of numbers \begin{equation} a_1, a_2, a_3, \ldots, a_N \end{equation} form a sequence of points in the plane by taking all pairs of consecutive terms \begin{equation} (a_1, a_2), (a_2, a_3), \ldots, (a_{N-1}, a_N) \end{equation} and plot these points on a 2D graph, joining consecutive points by a line segment.

Example

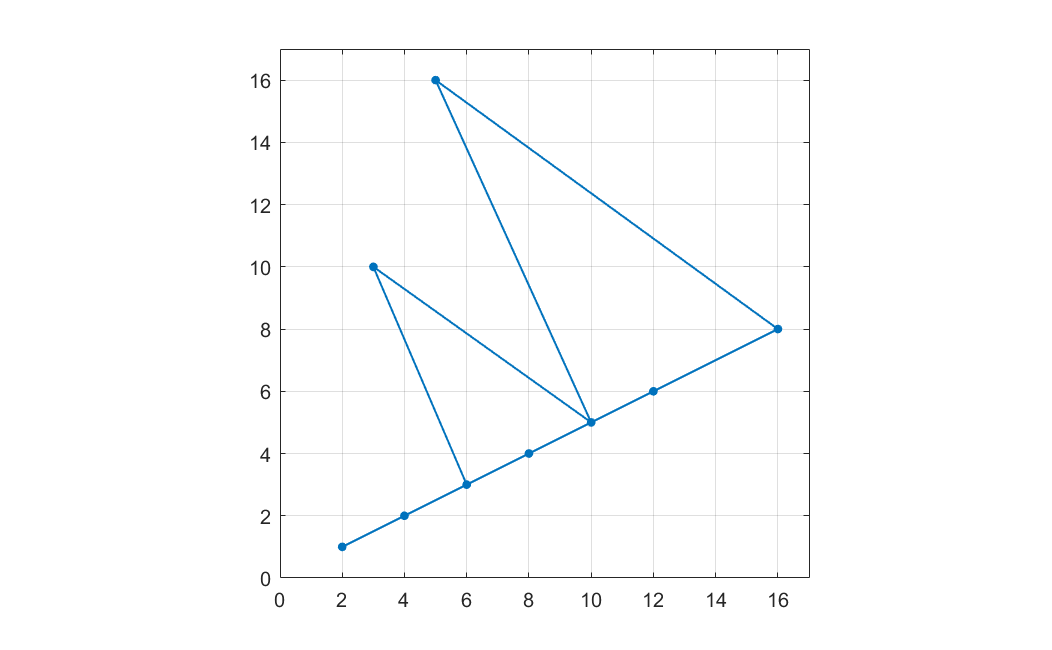
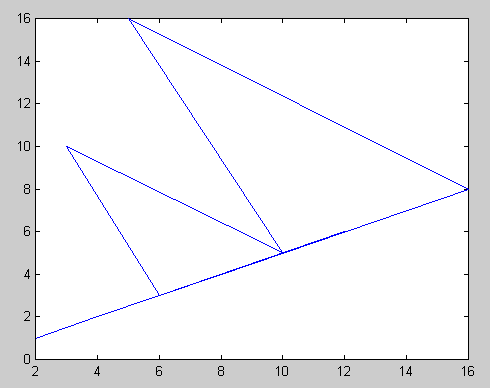
For input \$12\$ the Collatz sequence is (\$10\$ terms); \begin{equation} 12, 6, 3, 10, 5, 16, 8, 4, 2, 1. \end{equation} The sequence of points is (\$9\$ points): \begin{equation} (12, 6), (6, 3), (3, 10), (10, 5), (5, 16), (16, 8), (8, 4), (4, 2), (2, 1). \end{equation} The plot contains \$8\$ line segments, as shown in the following graph. Note that some of the segments partially overlap. For clarity, the plot includes markers at the \$9\$ points.

enter image description here

Additional rules

  • Graphical output is required, with output being flexible as usual.
  • Only the straight lines are required in the graph. Line width is flexible, as long as the plot can be seen reasonably well. Line color is also flexible, and may be different for each segment, as long as lines are distinguishable from the background.
  • Other elements in the graph are not required, but are allowed (point markers, grid lines, axis labels, ...).
  • Horizontal and vertical axis scales need not be the same. Axis limits are arbitrary, as long as the graph can be seen fully and clearly. The axes may be swapped, and each axis may be reversed.
  • The code should work for any input given unlimited resources. It is acceptable if in practice it fails for large inputs due to time, memory or data-type limitations.
  • If the input happens to be a counterexample for the Collatz conjecture the code can do anything, such as get stuck in an infinite loop or order a pizza.
  • Programs or functions are accepted. Standard loopholes are forbidden.
  • Shortest code in bytes wins.
Test cases

Input Output
3 enter image description here
4 enter image description here
27 enter image description here
649 enter image description here
650 enter image description here
46720 enter image description here
345435 enter image description here
63728127 enter image description here
\$\endgroup\$
6
  • \$\begingroup\$ Related \$\endgroup\$
    – Luis Mendo
    Commented Jun 11, 2021 at 22:39
  • 6
    \$\begingroup\$ This is beautiful! \$\endgroup\$
    – AviFS
    Commented Jun 12, 2021 at 3:40
  • \$\begingroup\$ Is an upside down y axis allowed? \$\endgroup\$ Commented Jun 12, 2021 at 8:02
  • \$\begingroup\$ @Nick Yes, no problem \$\endgroup\$
    – Luis Mendo
    Commented Jun 12, 2021 at 9:12
  • \$\begingroup\$ "If the Collatz conjecture is false the code can do anything, such as get stuck in an infinite loop or order a pizza." – I guess you want to say "If you hit a counter example for the Collatz conjecture, ..." \$\endgroup\$ Commented Jun 12, 2021 at 19:50

13 Answers 13

16
\$\begingroup\$

Python 3.8 with turtle, 156 127 bytes

Thanks to Noodle9 for catching a mistake!

from turtle import*
def f(n,x=0):
 while~-n:goto(w:=n,n:=[n//2,3*n+1][n%2]);x<1!=clear();setworldcoordinates(0,0,x:=max(x,n),x)

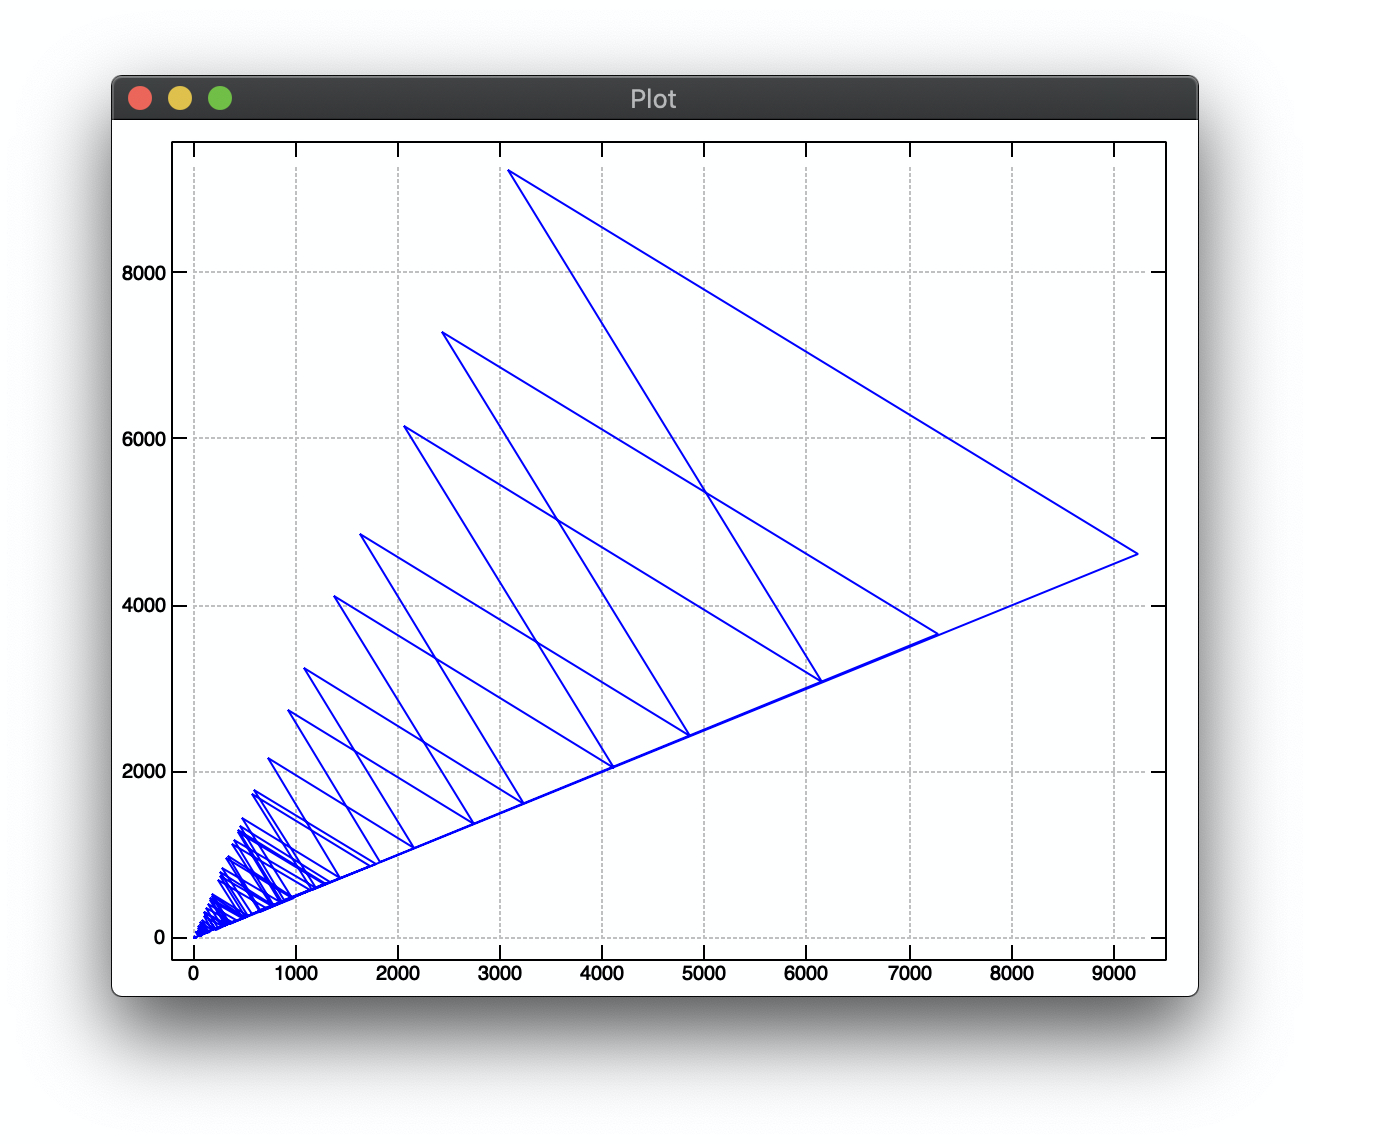
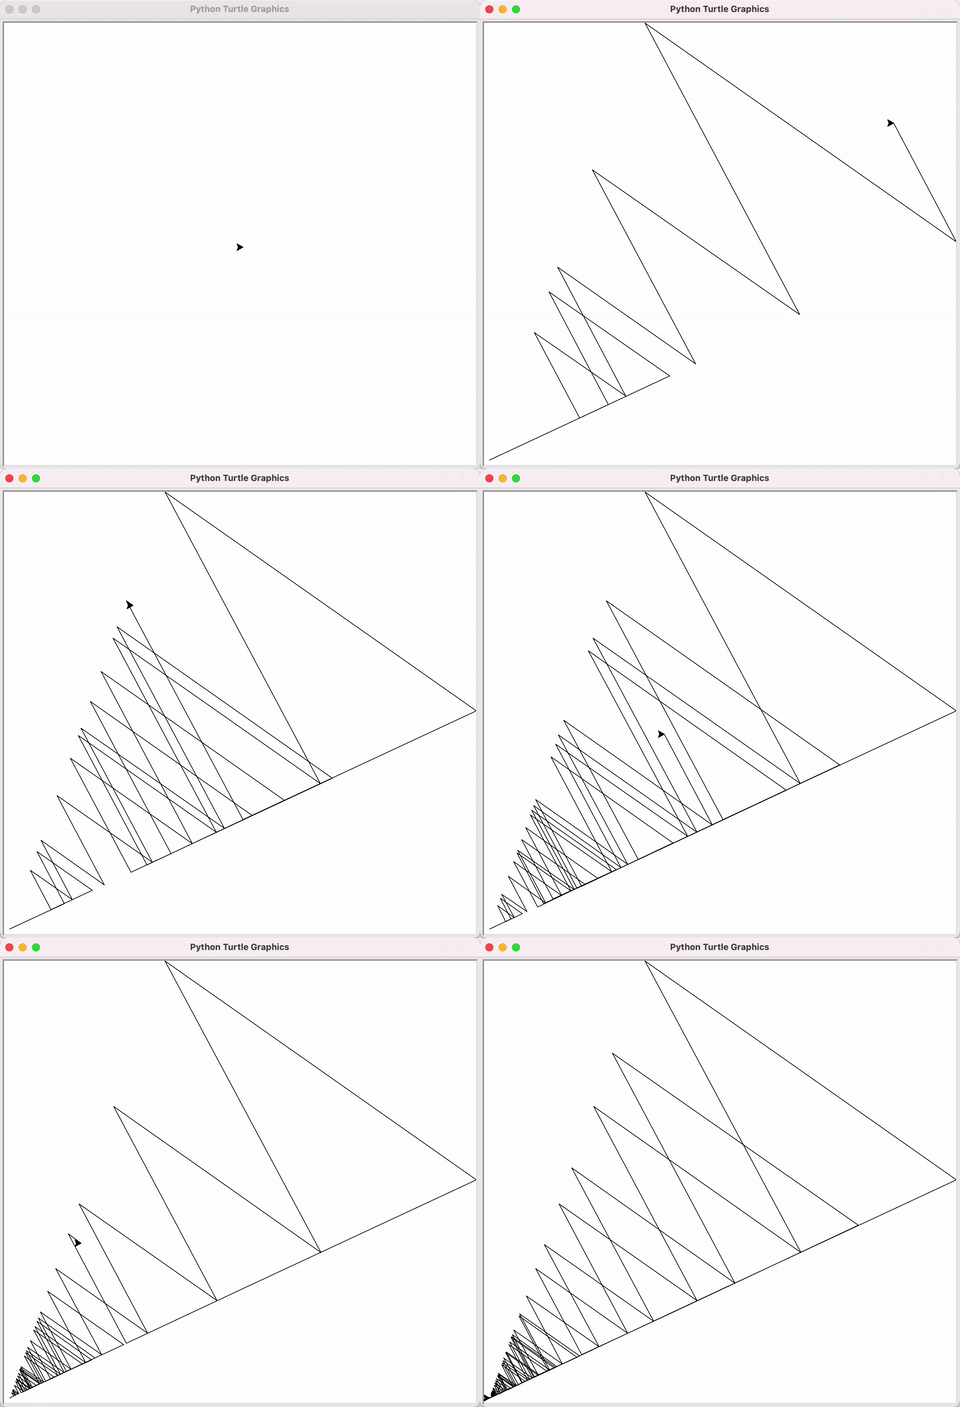
Animation for \$a_1=27\$:

animation of turtle for testcase 27

\$\endgroup\$
4
  • 1
    \$\begingroup\$ It may just be my computer, but get weird outputs for \$3\$, \$4\$, and \$650\$. Also doesn't clear the screen in between runs. \$\endgroup\$
    – Noodle9
    Commented Jun 12, 2021 at 12:24
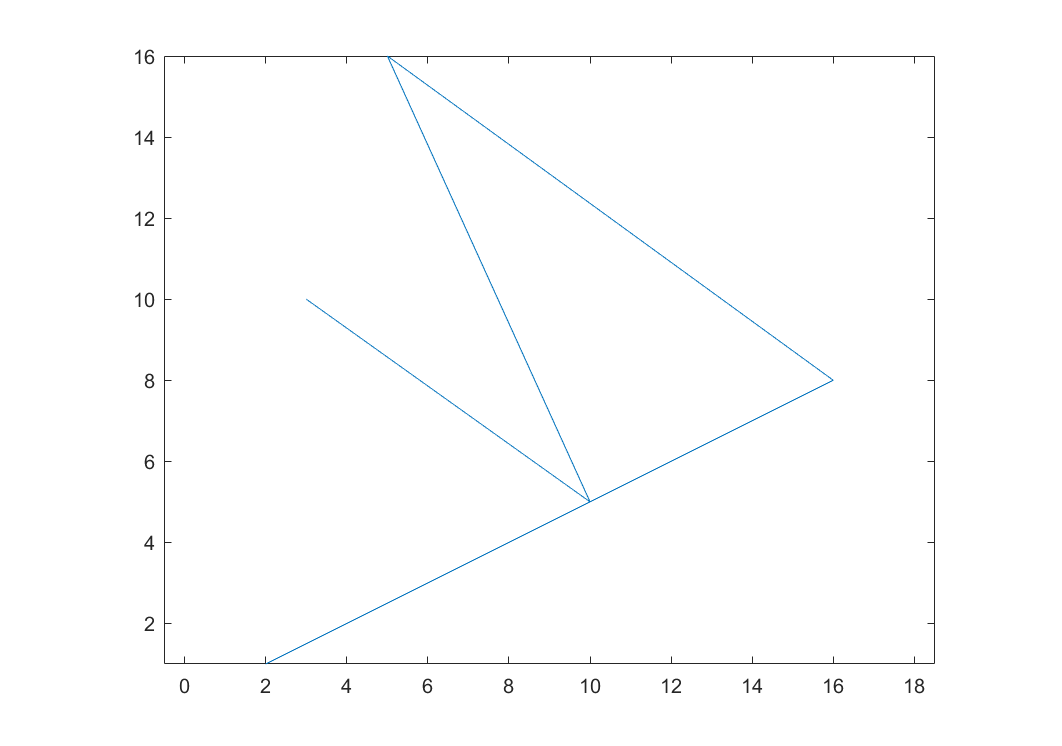
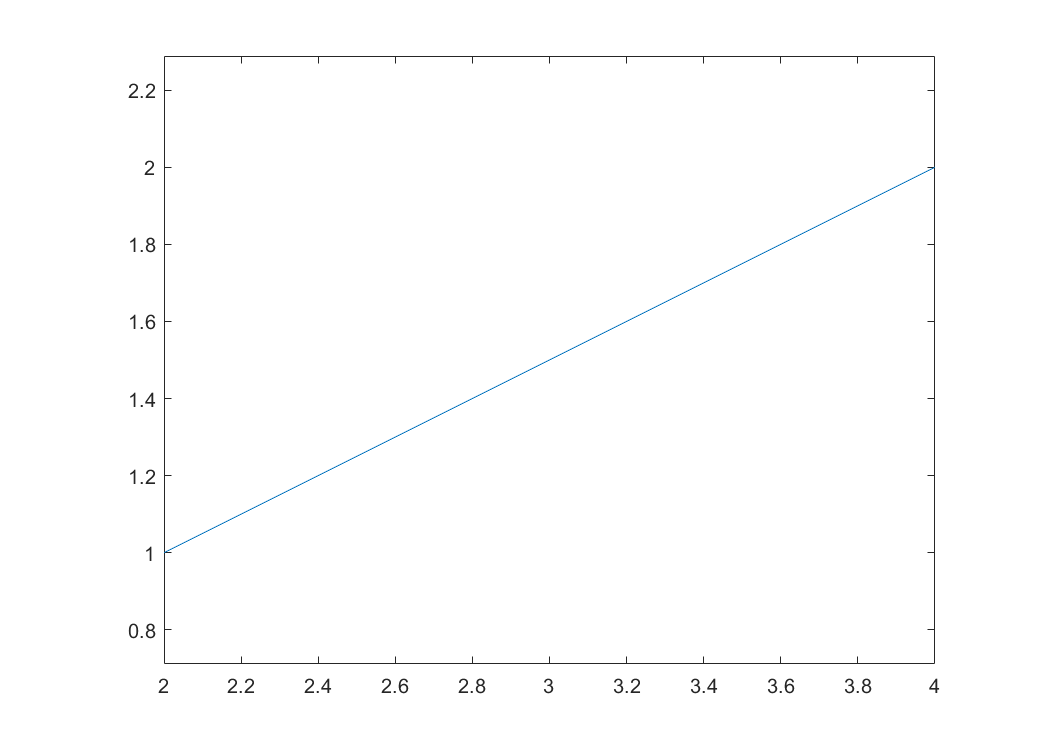
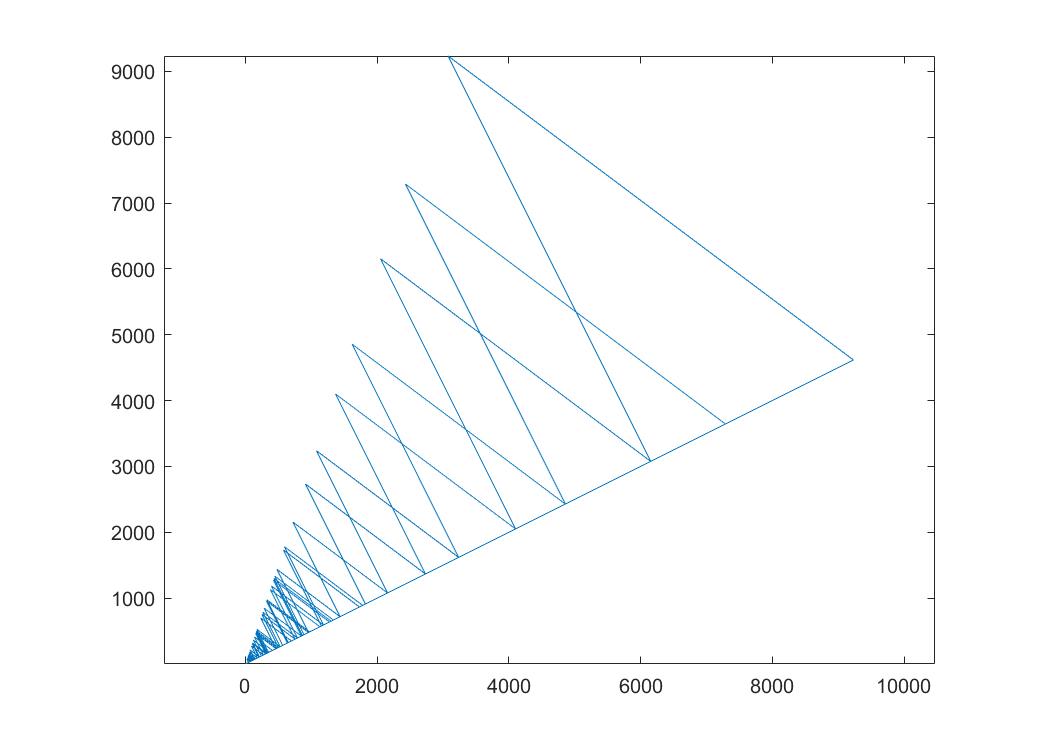
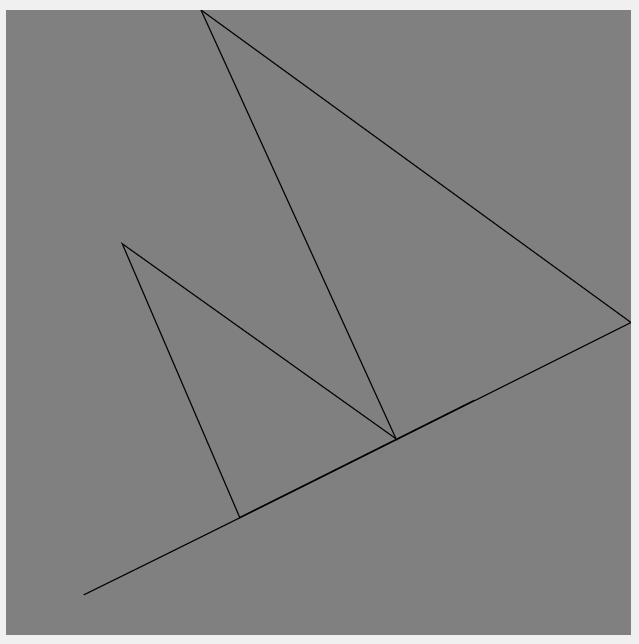
  • \$\begingroup\$ @Noodle9 I thought setworldcoordinates would clear the screen, but apparently this isn't the case. Here are my outputs for 3, 4 and 650. For 3 and 4 there is a lot of padding to the bottom/left, but I think this is fine with the rule Axis limits are arbitrary, as long as the graph can be seen fully and clearly \$\endgroup\$
    – ovs
    Commented Jun 12, 2021 at 13:11
  • \$\begingroup\$ Makes sense, also \$650\$ looks fine now. \$\endgroup\$
    – Noodle9
    Commented Jun 12, 2021 at 13:18
  • \$\begingroup\$ Yes, no problem with padding \$\endgroup\$
    – Luis Mendo
    Commented Jun 12, 2021 at 18:39
9
\$\begingroup\$

J, 52 bytes

load 'plot'
f=:[:plot[:(}:;}.)(2&|{-:,1+*&3)^:(>&1)^:a:

Try it online!

Wasn't sure if loading the graphics lib counted towards byte count, so I included it.

Here's an image of calling f 27 in the J console:

27

\$\endgroup\$
5
  • 1
    \$\begingroup\$ Yes, you have to include any needed loads/imports/includes in the byte count, that's one of the big challenges golfing in Python. \$\endgroup\$
    – Noodle9
    Commented Jun 12, 2021 at 13:23
  • \$\begingroup\$ Is the TIO link any use in this case? \$\endgroup\$
    – Luis Mendo
    Commented Jun 12, 2021 at 18:38
  • \$\begingroup\$ Not much. I mostly used it to count for me. But you could delete [:plot and run it to verify that it was producing the correct x and y coord lists. \$\endgroup\$
    – Jonah
    Commented Jun 12, 2021 at 18:40
  • \$\begingroup\$ Is the f=: necessary? Can you not just have an anonymous function? \$\endgroup\$ Commented Jun 13, 2021 at 12:34
  • \$\begingroup\$ @caird I'm not counting those 3 bytes. I just wanted it to be clear how it's intended to be used, ie, calling it like f 27. If it were anonymous it would need parens around it to be called like that. \$\endgroup\$
    – Jonah
    Commented Jun 13, 2021 at 14:52
7
\$\begingroup\$

Jelly, 35 bytes

r0×€:⁸
×3‘ƊHḂ?Ƭ;Ɲ_/AÞṪçƊ+ṪƲƝẎŒṬx€€3

Try it online!

A pair of links that takes an integer argument and returns an RGB matrix on the (0 to 1) scale. Approach is the same as PBM output below but loses some bytes from the simpler output format.


Previous PBM answer Jelly, 49 44 bytes

r0×€:⁸
×3‘ƊHḂ?Ƭ;Ɲ_/AÞṪçƊ+ṪƲƝẎŒṬµZL;L;FKṭ“P1 

Try it online!

A full program that takes an integer argument and prints the contents of a PBM file.

Thanks to @cairdcoinheringaahing for some nice golfs totally 5 bytes!

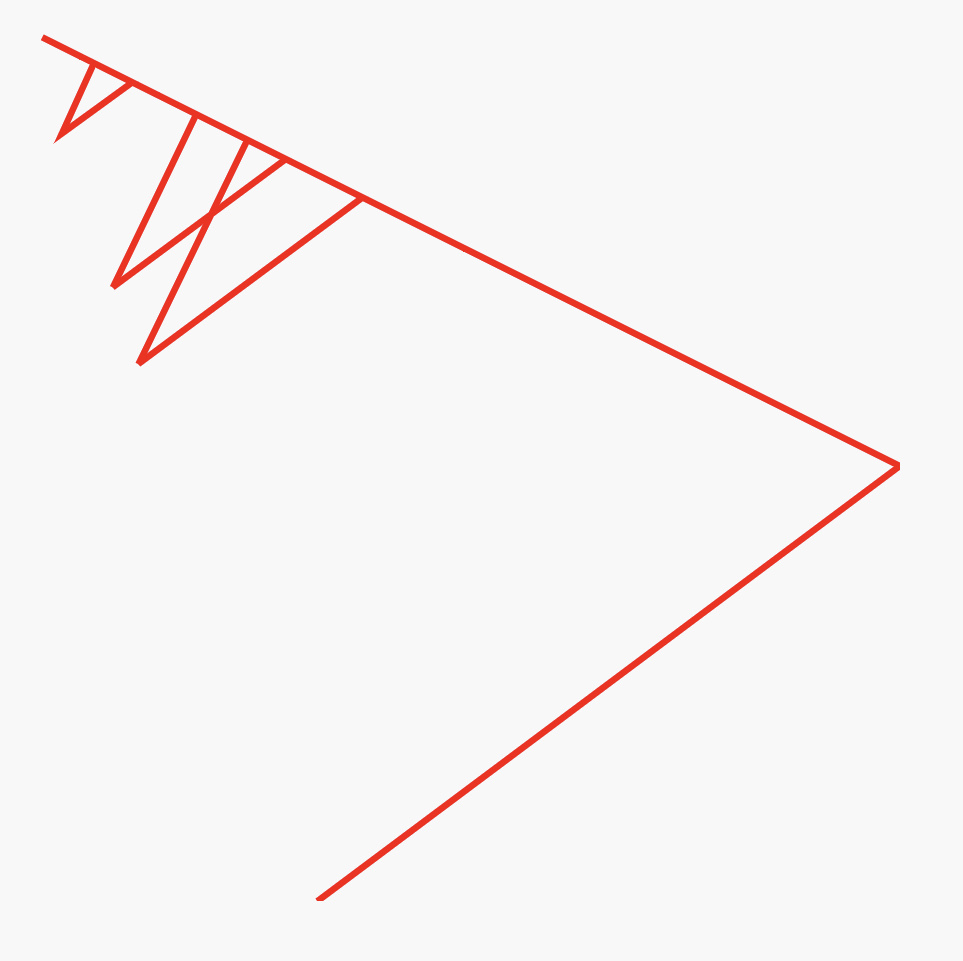
Example for 22:

Example image for 22


Original SVG-based answer: Jelly, 83 bytes

×3‘ƊHḂ?Ị¬$пµj”,$ƝKṭṀ,`$“¡×ȯFṗẓ"az⁺Ṭ*,ġẎlḣḂ⁷Ọ]Ẏɦ?÷hṖF.IØṣƘŻÇÄ<,Ḥ:ẆṡṂȮXȷḷ[eʂmJ]»Ỵ¤;"

Try it online!

A full program taking an integer argument and printing an SVG.

For example, with 45:

<svg width="136" height="136"><path stroke="red" fill="none" d="M45,136 136,68 68,34 34,17 17,52 52,26 26,13 13,40 40,20 20,10 10,5 5,16 16,8 8,4 4,2 2,1"/></svg>

Example SVG

\$\endgroup\$
5
  • \$\begingroup\$ is upside-down y axis allowed? \$\endgroup\$
    – Razetime
    Commented Jun 12, 2021 at 8:01
  • 1
    \$\begingroup\$ Yes, it is (I just included it in the challenge) \$\endgroup\$
    – Luis Mendo
    Commented Jun 12, 2021 at 9:14
  • \$\begingroup\$ 46 bytes \$\endgroup\$ Commented Jun 12, 2021 at 19:31
  • \$\begingroup\$ 44 bytes if we can assume the Collatz conjecture is true (which we can) \$\endgroup\$ Commented Jun 12, 2021 at 19:32
  • \$\begingroup\$ @cairdcoinheringaahing thanks! Yes of course. We have to assume the conjecture is true either way but I’d missed the fact that the input will always be >2 and so the only path to 1 goes via 4, 2, 1 and prevents a bounce back up to 4. \$\endgroup\$ Commented Jun 12, 2021 at 19:37
7
\$\begingroup\$

R >= 4.1, 81 74 bytes

\(x,y=x){while(x>1)y=c(y,x<-c(x/2,3*x+1)[x%%2+1]);plot(y,c(y[-1],NA),"l")}

Try it at RDRR.io!

Note this uses RDRR because TIO doesn’t support graphical output. It also uses function in place of \ since RDRR doesn’t support R 4.1.0 yet.

Thanks to @DominicVanEssen for saving 7 bytes!

\$\endgroup\$
1
  • 1
    \$\begingroup\$ 74 bytes - \(x,y=x){while(x>1)y=c(y,x<-c(x/2,3*x+1)[x%%2+1]);plot(y,c(y[-1],NA),"l")} \$\endgroup\$ Commented Jun 11, 2021 at 23:29
6
\$\begingroup\$

Wolfram Language (Mathematica), 70 bytes

Graphics@Line@Last@Reap[#//.a_/;a>1:>Last@Sow@{a,If[2∣a,a/2,3a+1]}]&

-17 bytes from @att

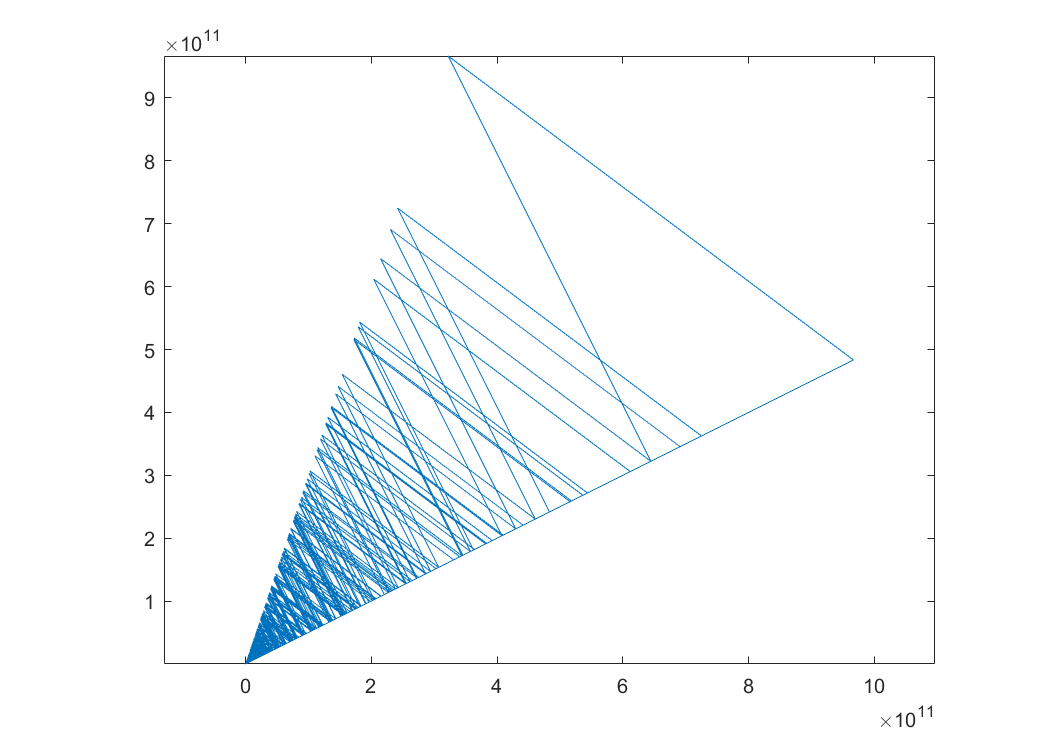
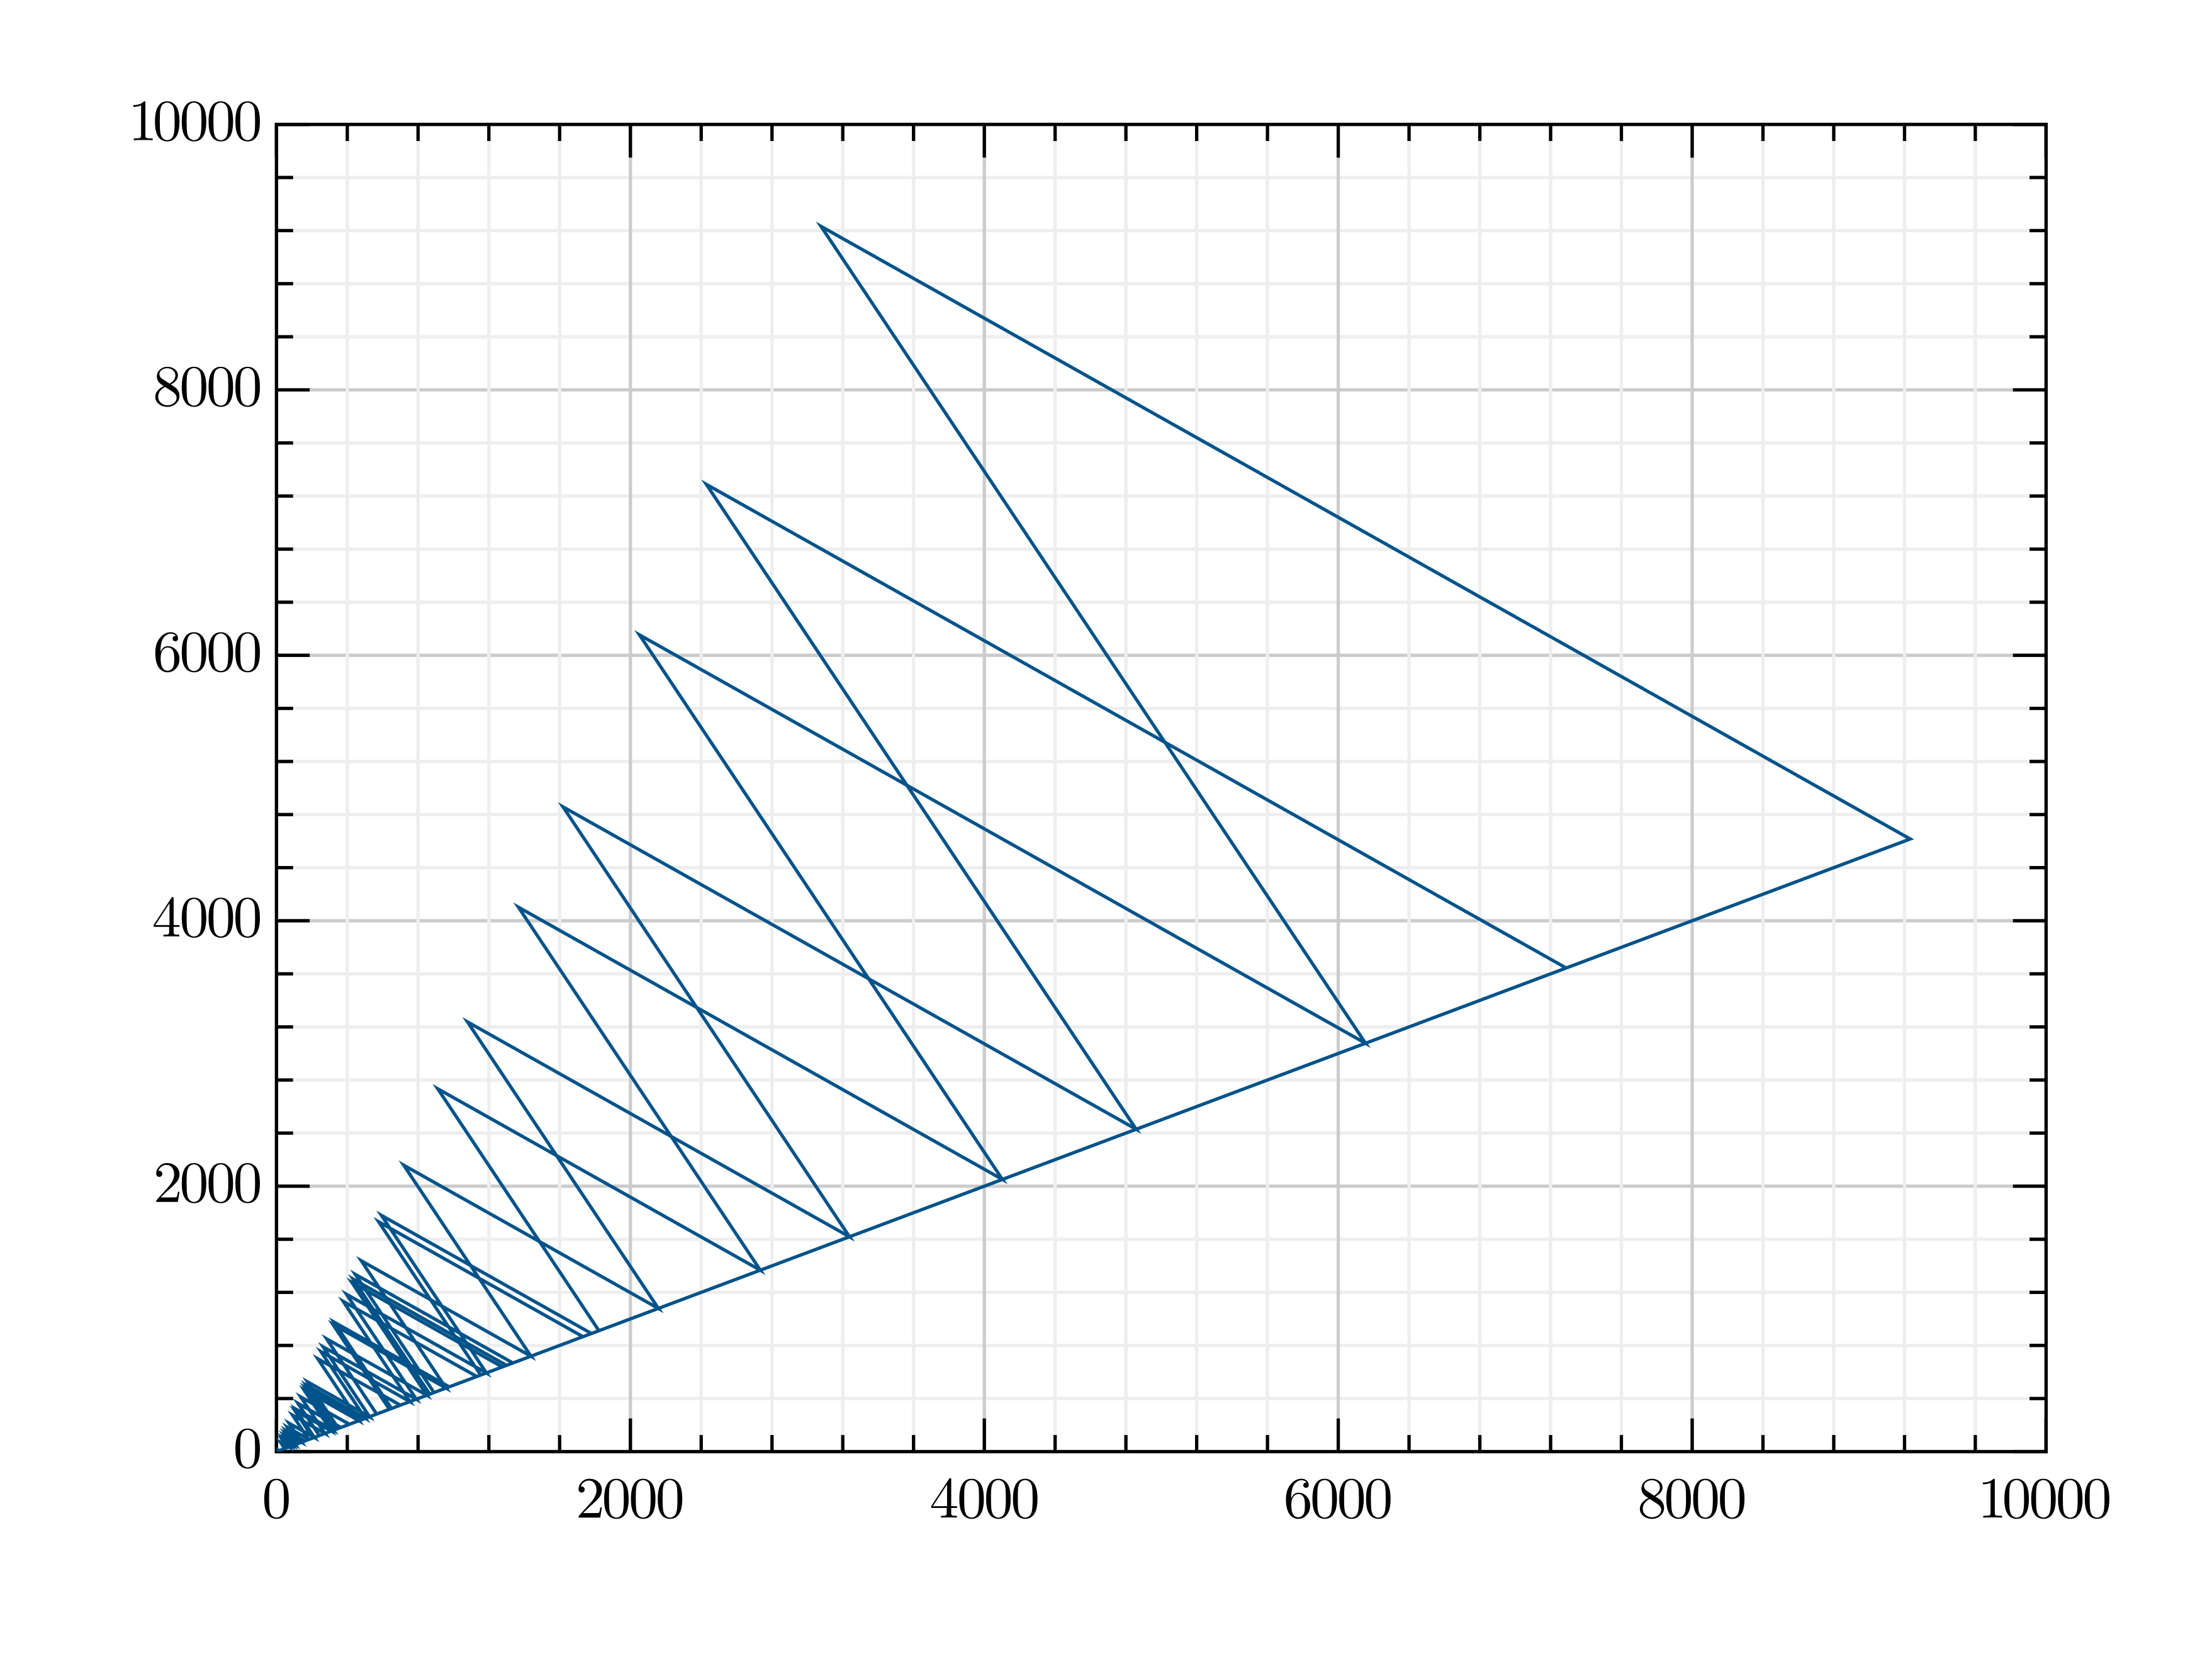
63728127 enter image description here

\$\endgroup\$
3
  • \$\begingroup\$ Graphics@Line@Partition[NestWhileList[If[OddQ@#,3#+1,#/2]&,#,#>1&],2,1]& for 72 \$\endgroup\$
    – att
    Commented Jun 12, 2021 at 3:49
  • \$\begingroup\$ Another -1: Graphics@Line@Partition[NestWhileList[If[2∣#,#/2,3#+1]&,#,#>1&],2,1]& \$\endgroup\$
    – att
    Commented Jun 12, 2021 at 18:45
  • \$\begingroup\$ 70 with Sow/Reap: Graphics@Line@Last@Reap[#//.a_/;a>1:>Last@Sow@{a,If[2∣a,a/2,3a+1]}]& \$\endgroup\$
    – att
    Commented Jun 13, 2021 at 19:29
6
\$\begingroup\$

Julia using GR, 121 99 77 bytes

Even better version by @MarcMush:

using GR
!x=while(X=x[end])>1 plot([x;],(x=[x;X%2>0 ? 3X+1 : X/2])[2:end])end

Improved version thanks to the tips found here:

using GR
c(a)=(i=1;while a[i]>1 a=[a;%(a[i],2)>0 ? 3a[i]+1 : a[i]/2];i+=1end;plot(a[1:i-1],a[2:i]))

What has been done:

  • single-line notation for functions -10 bytes
  • replace push! by array concatenation -3 bytes
  • use input a as array - 6 bytes
  • replace end by variable i that stores the length -3 bytes

Original version:

using GR
function c(x) a=[x]
while a[end]>1 push!(a,%(a[end],2)>0 ? 3a[end]+1 : a[end]/2)end
plot(a[1:end-1],a[2:end])end

Calling c(27) gives: enter image description here

\$\endgroup\$
4
  • 1
    \$\begingroup\$ nice first answer! check out Tips for golfing in Julia, you can reduce your answer a bit more \$\endgroup\$
    – MarcMush
    Commented Jun 13, 2021 at 22:17
  • 1
    \$\begingroup\$ my turn to shave off 22 bytes ;) 77 bytes \$\endgroup\$
    – MarcMush
    Commented Jun 14, 2021 at 18:01
  • 1
    \$\begingroup\$ Wow, that's amazing what you did there ... seams like there is still a lot to learn then :D \$\endgroup\$
    – mapi1
    Commented Jun 15, 2021 at 13:36
  • \$\begingroup\$ feel free to include my improvements in your answer and to continue improving it \$\endgroup\$
    – MarcMush
    Commented Jun 16, 2021 at 17:43
4
\$\begingroup\$

SageMath, 81 \$\cdots\$ 74 71 bytes

Saved 3 bytes thanks to dingledooper!!!

f=lambda n,*r:n-1and f(c:=[n/2,3*n+1][n%2],*r,(n,c))or list_plot(r,1<2)

Try it online!

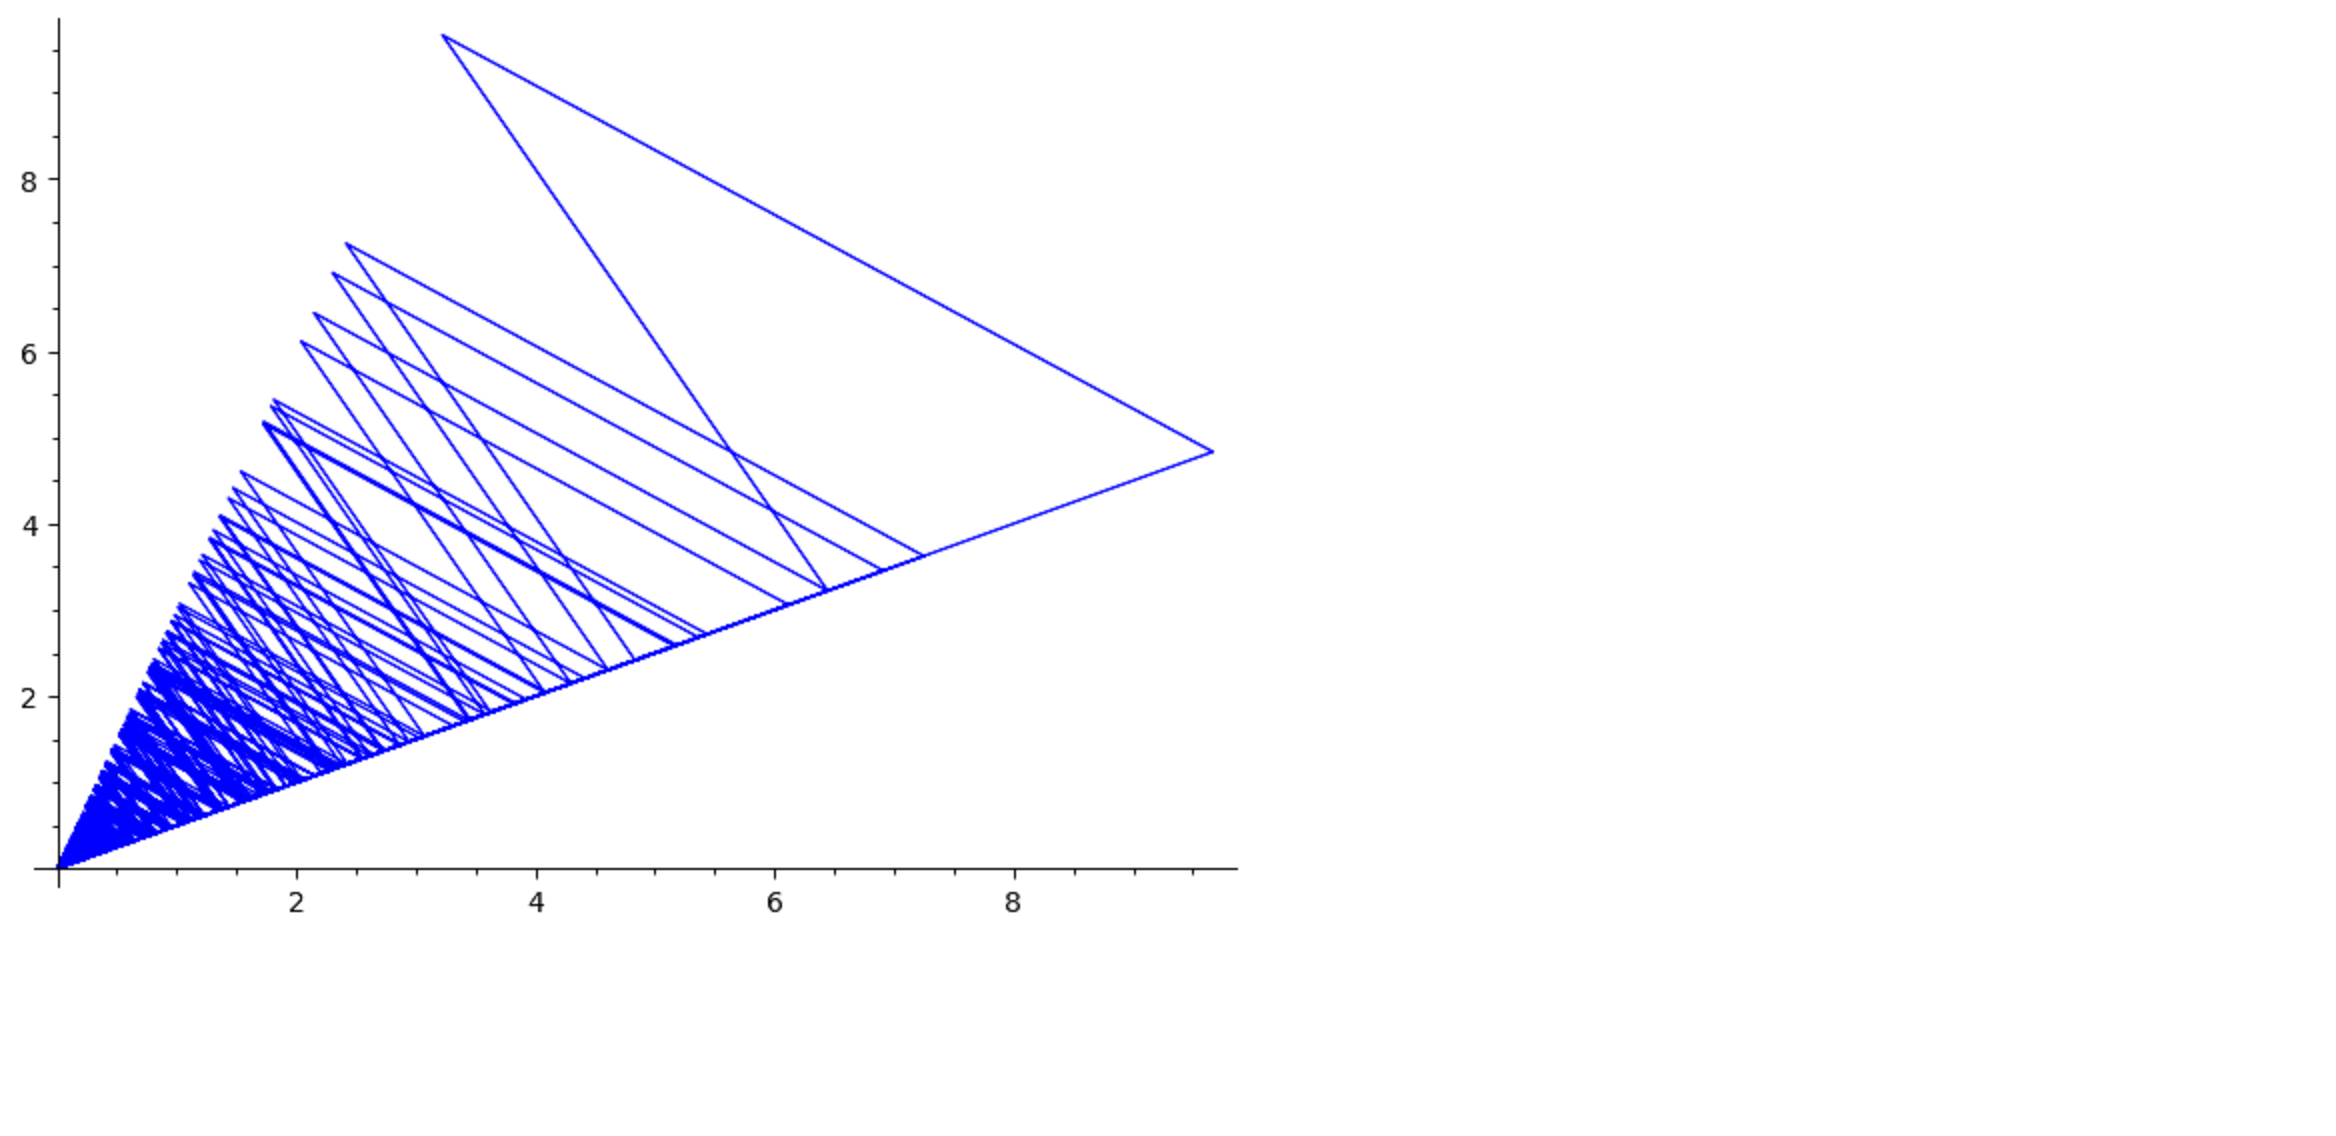
f(63728127)

f(63728127)

\$\endgroup\$
2
  • \$\begingroup\$ 71 bytes \$\endgroup\$ Commented Jun 12, 2021 at 0:55
  • \$\begingroup\$ @dingledooper Nice one - thanks! :D \$\endgroup\$
    – Noodle9
    Commented Jun 12, 2021 at 9:02
4
\$\begingroup\$

Red, 230 212 bytes

func[n][a: to[]n while[n > 1][append a n: either odd? n[3 * n + 1][n / 2]]to-pair m: last sort copy a view[base 500x500 draw append[line]collect[while[a/2][keep as-pair a/1 / m * 500(first a: next a)/ m * 500]]]]

Try it online!

I don't know if red has a scalable plotting mechanism, but this was what I managed to get using the draw dialect. All outputs are scaled to 500x500 and there may be some inaccuracies for larger inputs due to downscaling and pairs being integers.

In the red interpreter, you will have to redefine the function before each run because the words get messed up.

-4 after using default axes.

-18 bytes from Galen Ivanov.

Output(n=12) (old)

enter image description here

\$\endgroup\$
1
  • 1
    \$\begingroup\$ I cleaned up you code a little for -18 bytes \$\endgroup\$ Commented Jun 12, 2021 at 18:23
3
\$\begingroup\$

Factor + ui.gadgets.charts ui.gadgets.charts.lines math.unicode, 208 204 199 bytes

[ [ [ 3 dupn , odd? [ 3 * 1 + ] [ 2/ ] if dup 1 ≠ ] loop , ] f make chart new over supremum 1 + '[ 0 _ ] dup 2array >>axes line new COLOR: red >>color rot 2 clump >>data add-gadget "" open-window ]

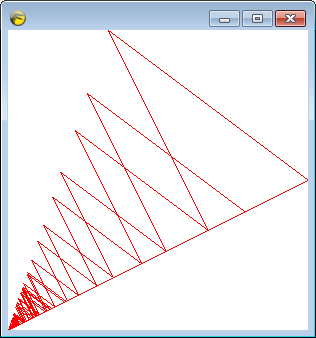
It's quotation (anonymous function) that accepts an integer from the data stack and opens a window with the chart in it. This only works in recent-ish builds of Factor, as the chart gadget is fairly new; I used build 2074. Here's what it looks like for an input of 27:

enter image description here

Unfortunately, the chart gadget doesn't come with any constructors. It requires us to manually calculate axes, and build its subcomponents which themselves don't come with any constructors. This leads to a bit of verbosity.

\$\endgroup\$
3
\$\begingroup\$

HTML + JS, 166 bytes

JS: 156 bytes

HTML: 14 bytes

This is a pretty basic implementation that renders to the DOM using an HTML canvas. A good chunk of the code is spent scaling the output to fit within the canvas. Anyone got any better ideas to handle this?

The input is specified inline in the code, set the number inside x=[...].

x=[9];c=C.getContext`2d`;c.beginPath();while((z=x[0])-1)x.unshift(z%2?3*z+1:z/2);r=Math.max(...x)/99;x.map((a,i)=>c.lineTo(a/r,99-x[i-1]/r));c.stroke()
<canvas id=C>

\$\endgroup\$
6
  • 1
    \$\begingroup\$ -14: c.beginPath(); is useless here, a path is started automatically at context's init. Now, it's unclear how your script is embedded in the HTML here, so take a +8 for <script> after the canvas opening tag and you end with 160. (Note that in the snippet you'd also need a </script> end tag, but I think it's not necessary if there is a true EOF, I'm on a phone rn and can't test myself.) \$\endgroup\$
    – Kaiido
    Commented Jun 12, 2021 at 9:08
  • \$\begingroup\$ A snippet may not be valid in which case your best bet may be a function which takes a and a canvas element as input and outputs by drawing on the passed-in canvas. \$\endgroup\$
    – Neil
    Commented Jun 12, 2021 at 16:40
  • \$\begingroup\$ @Kaiido I/O needs to be an image. A 2d context isn't itself an image. \$\endgroup\$
    – Neil
    Commented Jun 12, 2021 at 23:48
  • \$\begingroup\$ (A typed array of RGB values would be OK though; that counts as an image.) \$\endgroup\$
    – Neil
    Commented Jun 12, 2021 at 23:49
  • 1
    \$\begingroup\$ @Kaiido There are two rules at play here: 1) functions that produce output may do so by writing to an (optionally additional) input rather than producing a return value 2) an image object is an acceptable i/o format (see the list of acceptable graphical i/o formats linked in the question). \$\endgroup\$
    – Neil
    Commented Jun 13, 2021 at 9:23
3
\$\begingroup\$

Python 3 + matplotlib, 127 bytes

def f(n,r=[]):
 k=n
 while ~-n:n=[n//2,3*n+1][n%2];r+=[n]
 p.plot(*zip(*[[k]+r,r]),'-o');p.show()
import matplotlib.pyplot as p

-5 bytes thanks to @ovs!!!

\$\endgroup\$
4
  • 1
    \$\begingroup\$ If you use n//2 instead of n/2, you don't need to convert n%2 to an integer and the loop condition can be changed to ~-n. \$\endgroup\$
    – ovs
    Commented Jun 12, 2021 at 5:42
  • \$\begingroup\$ And pyplot.plot can take x and y coordinates separately, so p.plot([k]+r,r[:-1],'-o') should work (I didn't test that) \$\endgroup\$
    – ovs
    Commented Jun 12, 2021 at 5:46
  • \$\begingroup\$ @ovs thanks for the tips!! \$\endgroup\$
    – Wasif
    Commented Jun 12, 2021 at 5:47
  • \$\begingroup\$ Remove the space between while and ~. Maybe [[k,*r],r]? \$\endgroup\$
    – user100690
    Commented Jun 12, 2021 at 6:26
2
\$\begingroup\$

MATLAB 1999, 95 84 bytes

-1 from Luis Mendo

n=input('');i=n;while i>1;i=(i+mod(i,2)*(5*i+2))/2;n=[n;i];end;plot([0/0;n],[n;0/0])

enter image description here

Even A(2:) and A(2:-1)` was unavailable at that time...

\$\endgroup\$
1
  • \$\begingroup\$ You can shorten while(i>1) to while i>1 \$\endgroup\$
    – Luis Mendo
    Commented Aug 8, 2023 at 12:19
1
\$\begingroup\$

Python + Pygame, 228 bytes

from pygame import*
d=display
n=int(input())
k=[]
while n>1:k+=[[n,n:=[n//2,3*n+1][n%2]]]
M=max(k)[0]
S=500
g=lambda s:[S*s[0]/M,S*s[1]/M]
s=d.set_mode([S,S])
for i,j in enumerate(k):draw.line(s,[99]*3,g(k[i-1]),g(j))
d.update()

No TIO link because Pygame is not supported there.

Reversed y-axis.

I could save one byte by setting S to 99 or something, but I chose not to for easier viewing. I could also change [99]*3 to [9]*3 but I chose not to for easier viewing.

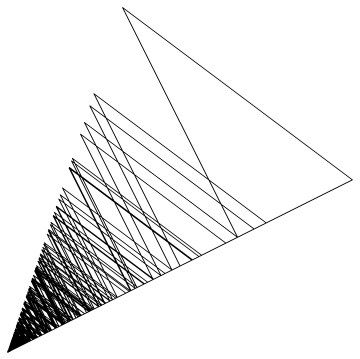
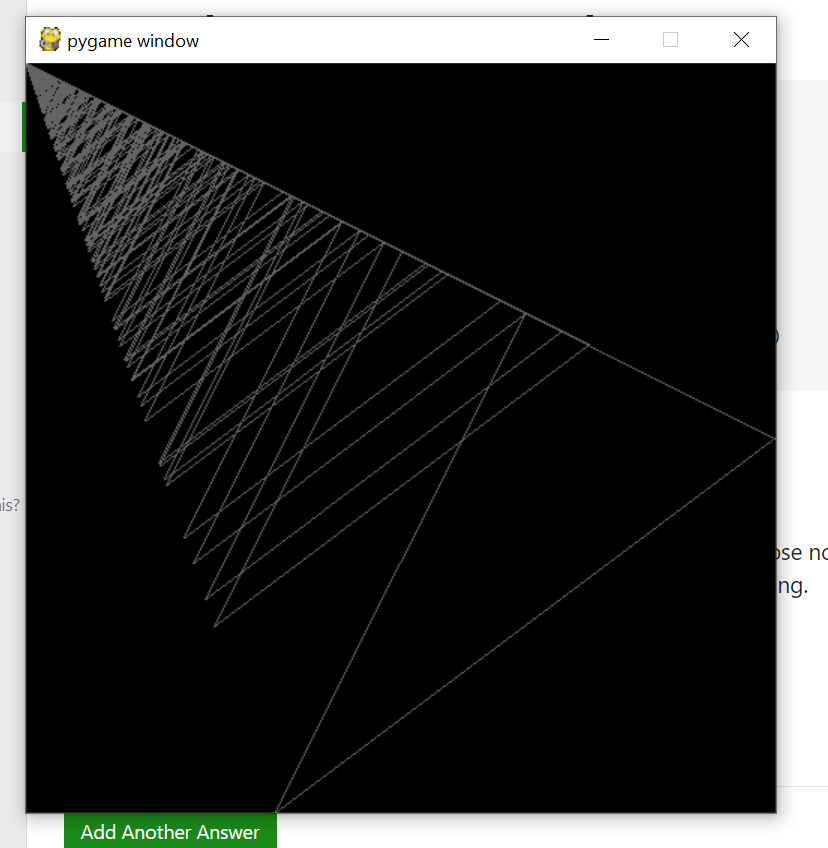
Here is an example for input 63728127: Example

\$\endgroup\$
0

Your Answer

By clicking “Post Your Answer”, you agree to our terms of service and acknowledge you have read our privacy policy.

Not the answer you're looking for? Browse other questions tagged or ask your own question.