-6
\$\begingroup\$

Please note that this question is different from this question. This one asks for graphical output, while the other one asks for ascii art.

Objective

Help! Timmy's graphing calculator broke! His calculator cannot graph anymore. However, he has found a way to add new programs and functions to his calculator. Your job is to write a program/function that graphs equations.

Rules

  • Your program/function should take in a string in the form of "y = random equation involving x" and graph it on the coordinate grid.
  • Timmy's calculator doesn't have that much memory, so please try to make your code as short as possible.
  • The operations needed are addition (+), subtraction (-), multiplication (*), division (/), exponentiation(^) and grouping(())
  • Your program/function should be able to graph from x=-5 to x=5, and from y=-5 to y=5.
  • Color, axis labels, the grid, numbers, scale, and animation are optional.
  • The minimum size of the image should be 50x50 pixels.

Test Cases

Input

y = x ^ 2

Output
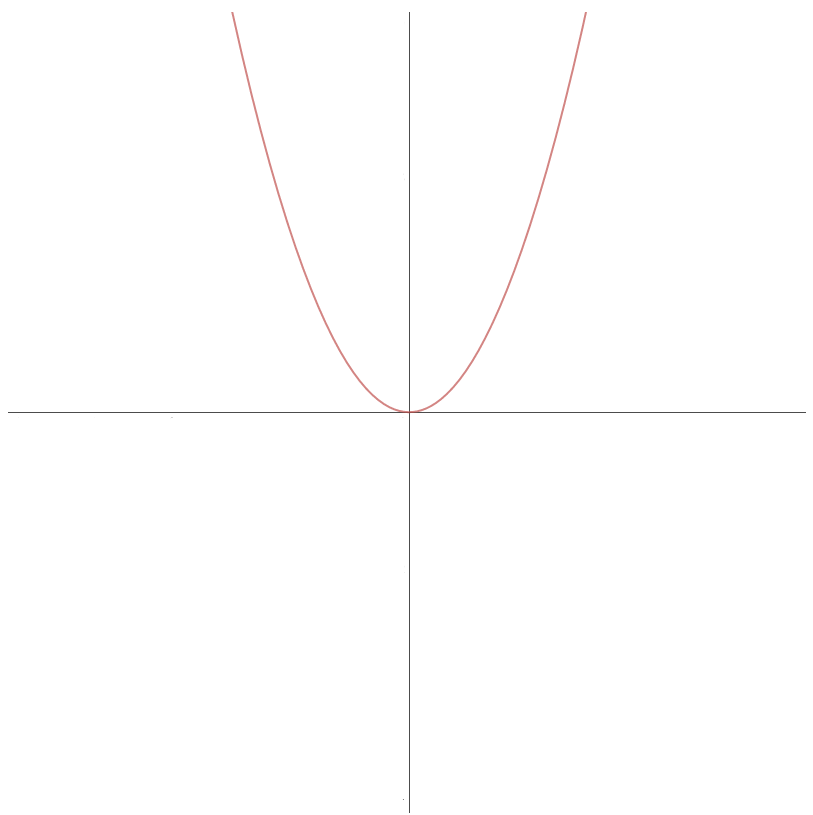
A graph of y=x^2

Input

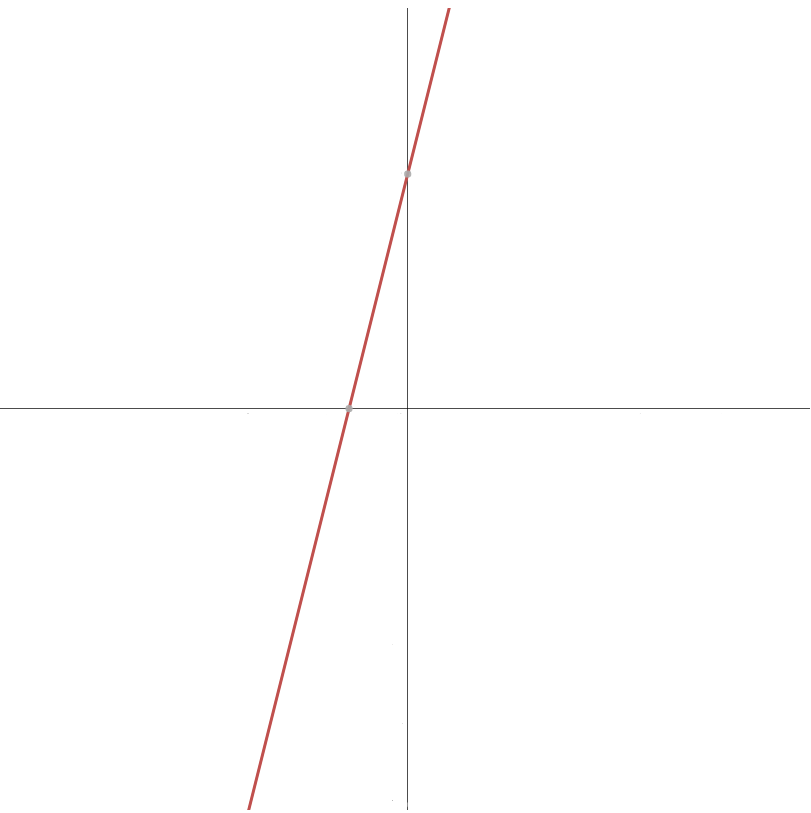
y = 4 * x + 3

Output

A graph of y=4x+3

Standard loopholes apply.

You may change the operators, but it adds +10% to your byte count.

\$\endgroup\$
16
  • 1
    \$\begingroup\$ What is the minimum size of the image to be output? \$\endgroup\$ Commented Mar 20, 2016 at 13:13
  • \$\begingroup\$ 50x50 pixels minimum. \$\endgroup\$ Commented Mar 20, 2016 at 13:22
  • 5
    \$\begingroup\$ Desmos, 0 bytes? It has been defined as a programming language. \$\endgroup\$
    – Arcturus
    Commented Mar 20, 2016 at 13:50
  • 1
    \$\begingroup\$ What does this mean: "Your program/function should be able to graph from x=-5 to x=5, and from y=-5 to y=5"? What should the boundaries be if y = 0.01*x? And what about y = 1000*x? Snould all boundaries be [-5, 5][-5, 5] regardless of what the function is? \$\endgroup\$ Commented Mar 20, 2016 at 13:55
  • 1
    \$\begingroup\$ I think you should ban plotting builtins. Those will lead to answers with just one function call. \$\endgroup\$
    – Denker
    Commented Mar 20, 2016 at 14:12

4 Answers 4

1
\$\begingroup\$

Matlab, 35 bytes

ezplot(input(''));axis([-5 5 -5 5])

Input is a string like 'y=2*x^2'.

\$\endgroup\$
1
  • \$\begingroup\$ Maybe you should clarify that the string needs to include the quotation marks \$\endgroup\$
    – Luis Mendo
    Commented Mar 21, 2016 at 21:56
0
\$\begingroup\$

Mathematica, 89 77 bytes

Plot[ToExpression[#~StringDrop~4],{x,-5,5},PlotRange->{-5,5},AspectRatio->1]&

Most of it is just formatting to make it look similar to the examples. Please inform me if something isn't required. Includes axis markers, which aren't explicitly disallowed.

\$\endgroup\$
1
  • \$\begingroup\$ The question says you do not need the axis markers. But if it reduces the byte count you can probably use them. \$\endgroup\$ Commented Mar 20, 2016 at 14:54
0
\$\begingroup\$

RPL/2 15*1.1 = 16.5

STEQ .5 *S DRAW

Timmy must key in the equation in capitals, e.g.'Y = X ^ 3', hence the 10% penalty.

The .5 is just luck: the default box is -10…10 × -10…10 with RPL/2.

\$\endgroup\$
0
\$\begingroup\$

MATL, 40 * 1.1 = 44

K0h)5:p'(-5:.1:5)'XHYXUHUw2$XG-5,5hth1ZG

This works in current version (15.0.0) of the language. EDIT (June 15, 2017): You can try it at MATL Online!

.*, ./ and .^ are for multiplication, division and power (that is, add a dot in front).

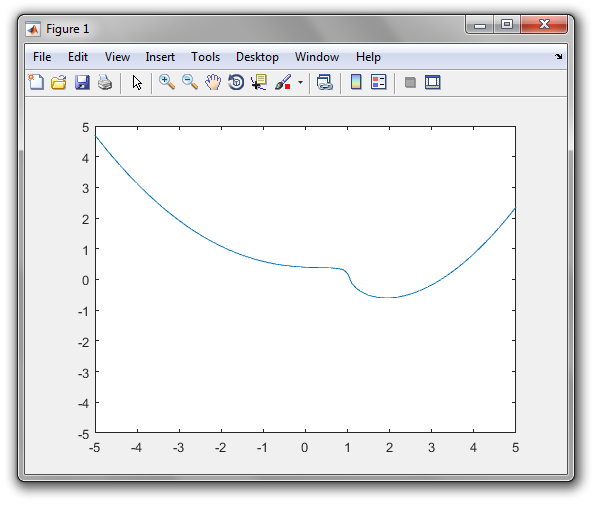
The following shows an example result running on Matlab.

enter image description here enter image description here

\$\endgroup\$

Your Answer

By clicking “Post Your Answer”, you agree to our terms of service and acknowledge you have read our privacy policy.

Not the answer you're looking for? Browse other questions tagged or ask your own question.