33
\$\begingroup\$

Apparently yes! In three easy steps.

Step 1

Let f(n) denote the prime-counting function (number of primes less than or equal to n).

Define the integer sequence s(n) as follows. For each positive integer n,

  • Initiallize t to n.
  • As long as t is neither prime nor 1, replace t by f(t) and iterate.
  • The number of iterations is s(n).

The iterative process is guaranteed to end because f(n) < n for all n.

Consider for example n=25. We initiallize t = 25. Since this is not a prime nor 1, we compute f(25), which is 9. This becomes the new value for t. This is not a prime nor 1, so we continue: f(9) is 4. We continue again: f(4) is 2. Since this is a prime we stop here. We have done 3 iterations (from 25 to 9, then to 4, then to 2). Thus s(25) is 3.

The first 40 terms of the sequence are as follows. The sequence is not in OEIS.

0 0 0 1 0 1 0 2 2 2 0 1 0 2 2 2 0 1 0 3 3 3 0 3 3 3 3 3 0 3 0 1 1 1 1 1 0 2 2 2

Step 2

Given an odd positive integer N, build an N×N array (matrix) by winding the finite sequence s(1), s(2), ..., s(N2) to form a square outward spiral. For example, given N = 5 the spiral is

s(21)   s(22)   s(23)   s(24)   s(25)
s(20)   s(7)    s(8)    s(9)    s(10)
s(19)   s(6)    s(1)    s(2)    s(11)
s(18)   s(5)    s(4)    s(3)    s(12)
s(17)   s(16)   s(15)   s(14)   s(13)

or, substituting the values,

 3       3       0       3       3
 3       0       2       2       2
 0       1       0       0       0
 1       0       1       0       1
 0       2       2       2       0

Step 3

Represent the N×N array as an image with a grey colour map, or with some other colour map of your taste. The map should be gradual, so that the order of numbers corresponds to some visually obvious order of the colours. The test cases below show some example colour maps.

The challenge

Given an odd positive integer N, produce the image described above.

Rules

  • The spiral must be outward, but can be clockwise or counter-clockwise, and can start moving right (as in the above example), left, down or up.

  • The scales of the horizontal and vertical axes need not be the same. Also axis labels, colorbar and similar elements are optional. As long as the spiral can be clearly seen, the image is valid.

  • Images can be output by any of the standard means. In particular, the image may be displayed on screen, or a graphics file may be produced, or an array of RGB values may be output. If outputting a file or an array, please post an example of what it looks like when displayed.

  • Input means and format are flexible as usual. A program or a function can be provided. Standard loopholes are forbidden.

  • Shortest code in bytes wins.

Test cases

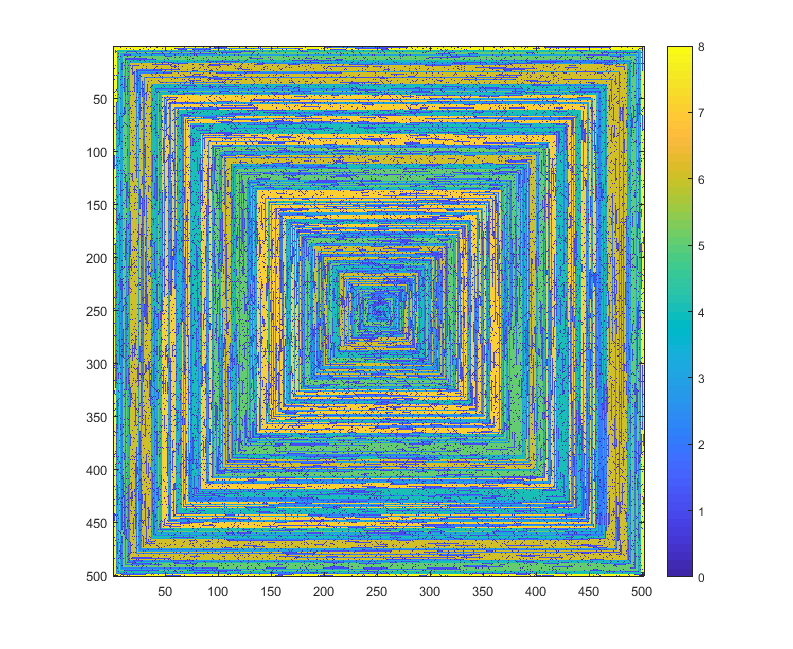
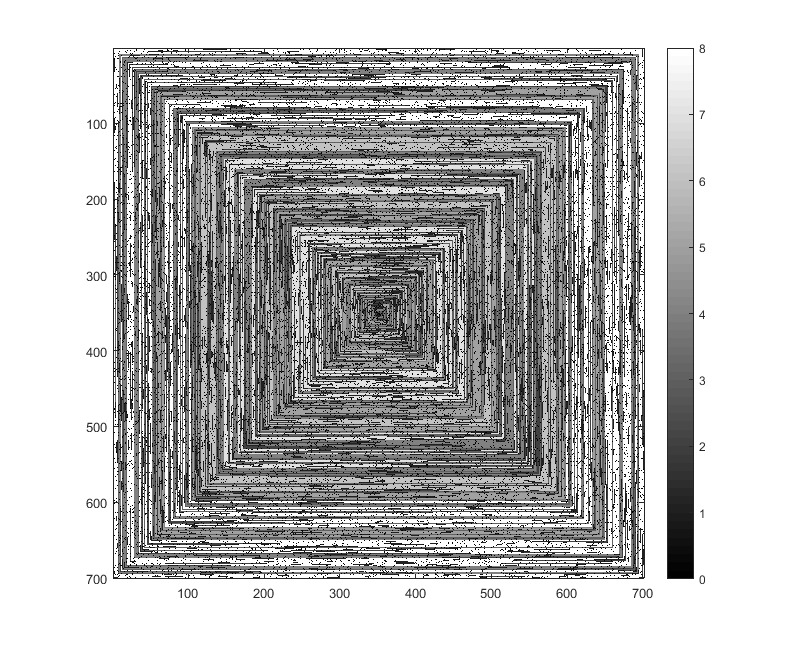
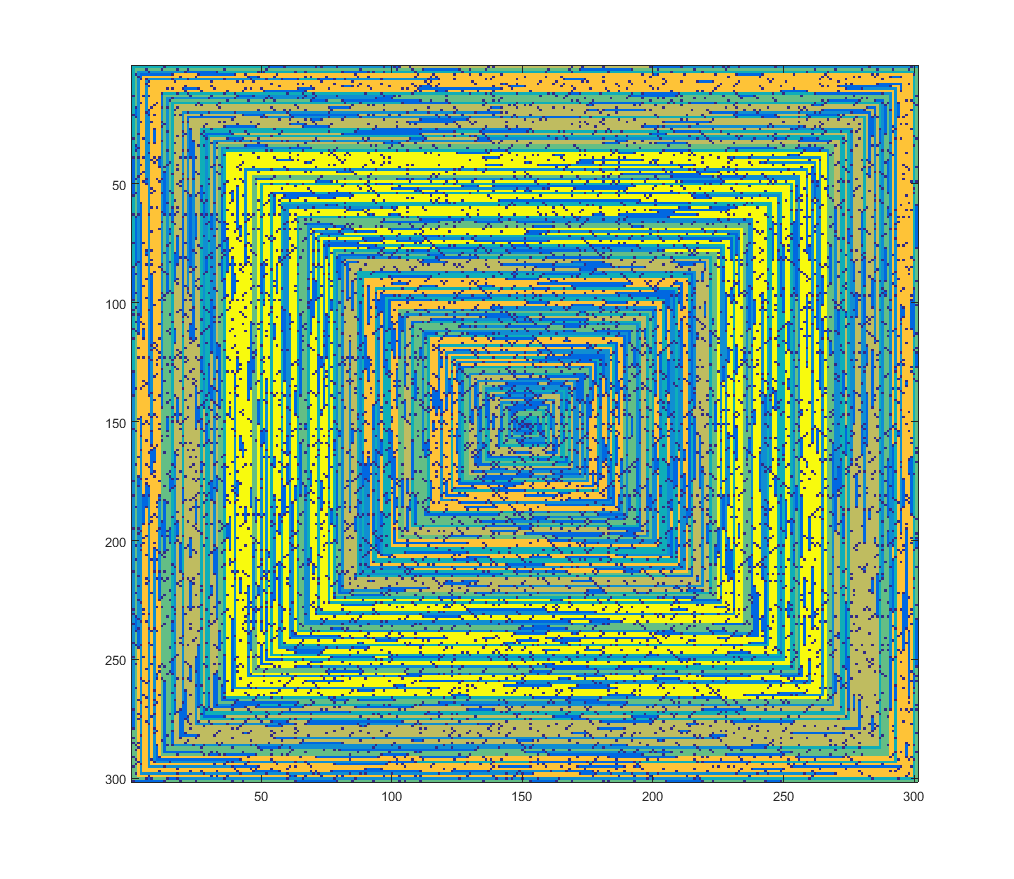
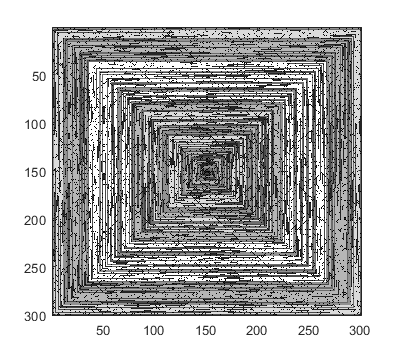
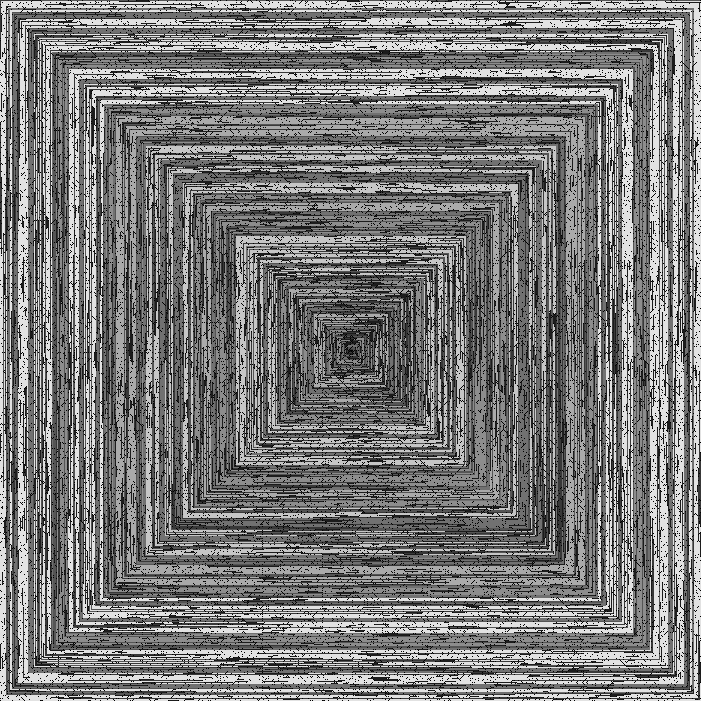
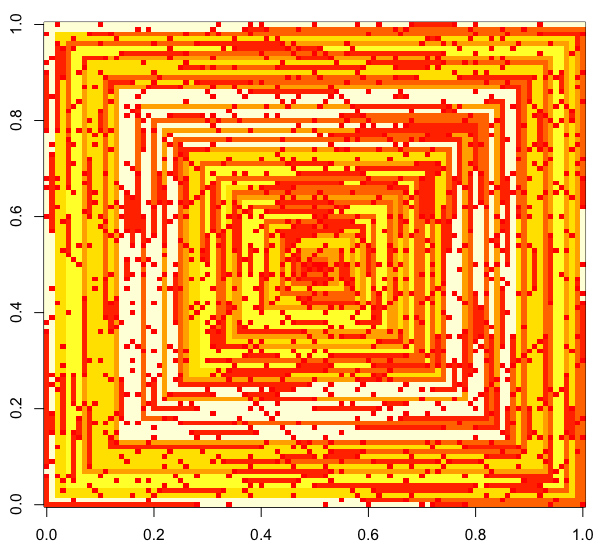
The following images (click for full resolution) correspond to several values of N. A clock-wise, rightward-first spiral is used, as in the example above. The images also illustrate several valid colour maps.

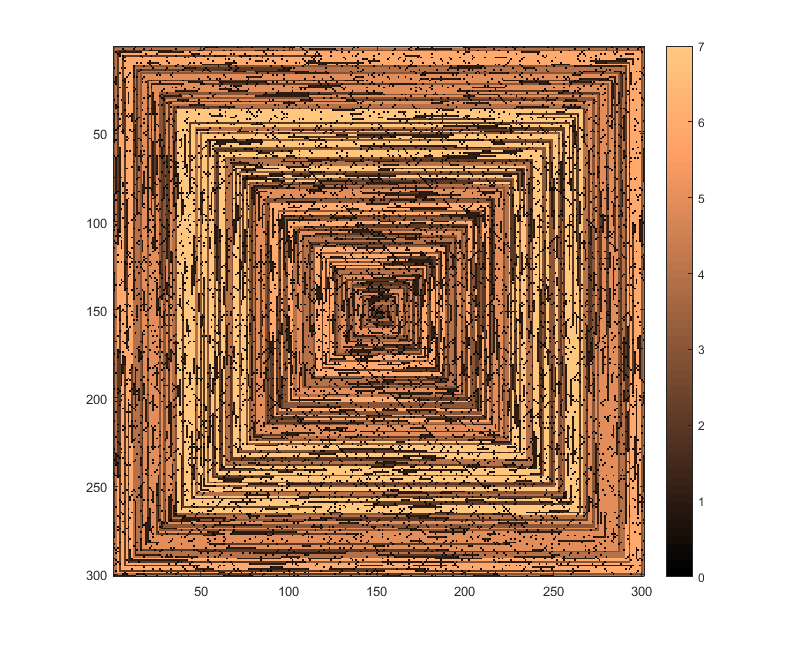
  • N = 301: enter image description here

  • N = 501: enter image description here

  • N = 701: enter image description here

\$\endgroup\$
12
  • \$\begingroup\$ If an array of values of s(n) can be fed into some plotting function/package without being modified (I think imshow in matplotlib could handle this for example) is this an acceptable output form? \$\endgroup\$
    – dylnan
    Commented Jan 30, 2018 at 21:39
  • \$\begingroup\$ @dylnan Sure, as long as it plots the image on screen or produces a file it's valid. In fact I generated the examples with something similar to what you mention. Just be careful with the scaling of values. For example it's not acceptable if all values above 1 are given the same color, as Matlab's (and possibly Matplotlib's) imshow does \$\endgroup\$
    – Luis Mendo
    Commented Jan 30, 2018 at 21:43
  • \$\begingroup\$ good point. Not sure if imshow does that. \$\endgroup\$
    – dylnan
    Commented Jan 30, 2018 at 21:45
  • 1
    \$\begingroup\$ @kamoroso94 Please see here \$\endgroup\$
    – Luis Mendo
    Commented Jan 31, 2018 at 14:46
  • 1
    \$\begingroup\$ Yeah very clear \$\endgroup\$
    – user63187
    Commented Jan 31, 2018 at 16:12

8 Answers 8

10
\$\begingroup\$

MATLAB - 197 185 178 175 184 163 162 148 142 140 bytes

Shaved 12 bytes, thanks to Ander and Andras, and lots thanks to Luis for putting the two together. Shaved 16 thanks to Remco, 6 thanks to flawr

function F(n)
p=@primes
s=@isprime
for a=2:n^2
c=0
if~s(a)
b=nnz(p(a))
while~s(b)
b=nnz(p(b))
c=c+1
end
end
d(a)=c
end
imagesc(d(spiral(n)))

Result for N=301 (F(301)):

enter image description here

Explanation:

function F(n)
p=@primes % Handle
s=@isprime % Handle
for a=2:n^2 % Loop over all numbers
    c=0 % Set initial count
    if~s(a) % If not a prime
        b=nnz(p(a)) % Count primes
        while~s(b) % Stop if b is a prime. Since the code starts at 2, it never reaches 1 anyway
            b=nnz(p(b)) % count again
            c=c+1 % increase count
        end
    end
    d(a)=c % store count
end
imagesc(d(spiral(n))) % plot
\$\endgroup\$
8
\$\begingroup\$

Wolfram Language (Mathematica), 124 bytes

Thanks to Martin Ender for saving 12 bytes!

Image[#/Max@#]&[Array[(n=0;Max[4#2#2-Max[+##,3#2-#],4#
#-{+##,3#-#2}]+1//.x_?CompositeQ:>PrimePi[++n;x];n)&,{#,#},(1-#)/2]]&

Try it online!


The image generated is:

Spiral

Closed form formula of the spiral value taken directly from this answer of mine.

\$\endgroup\$
7
  • 5
    \$\begingroup\$ #/2-.5 saves a byte. \$\endgroup\$
    – user202729
    Commented Jan 31, 2018 at 14:40
  • 8
    \$\begingroup\$ Haha, are you suggesting that to yourself? \$\endgroup\$
    – Luis Mendo
    Commented Jan 31, 2018 at 14:42
  • 6
    \$\begingroup\$ @user202729 Doesn't seem to work. \$\endgroup\$
    – user202729
    Commented Jan 31, 2018 at 14:42
  • 18
    \$\begingroup\$ I didn't mean to interrupt your inner dialogue :-P \$\endgroup\$
    – Luis Mendo
    Commented Jan 31, 2018 at 15:00
  • \$\begingroup\$ Defer the definition of p until you need it: ...,{y,p=(1-#)/2,-p},{x,p,-p} \$\endgroup\$ Commented Feb 3, 2018 at 22:08
7
\$\begingroup\$

MATLAB: 115 114 110 bytes

One liner (run in R2016b+ as function in script) 115 bytes

I=@(N)imagesc(arrayfun(@(x)s(x,0),spiral(N)));function k=s(n,k);if n>1&~isprime(n);k=s(nnz(primes(n)),k+1);end;end

Putting the function in a separate file, as suggested by flawr, and using the 1 additional byte per additional file rule

In the file s.m, 64 + 1 bytes for code + file

function k=s(n,k);if n>1&~isprime(n);k=s(nnz(primes(n)),k+1);end

Command window to define I, 45 bytes

I=@(N)imagesc(arrayfun(@(x)s(x,0),spiral(N)))

Total: 110 bytes


This uses recursion instead of while looping like the other MATLAB implementations do (gnovice, Adriaan). Run it as a script (in R2016b or newer), this defines the function I which can be run like I(n).

Structured version:

% Anonymous function for use, i.e. I(301)
% Uses arrayfun to avoid for loop, spiral to create spiral!
I=@(N)imagesc(arrayfun(@(x)s(x,0),spiral(N)));

% Function for recursively calculating the s(n) value
function k=s(n,k)
    % Condition for re-iterating. Otherwise return k unchanged
    if n>1 && ~isprime(n)
        % Increment k and re-iterate
        k = s( nnz(primes(n)), k+1 );
    end
end

Example:

I(301)

plot

Notes:

  • I tried to make the s function anonymous too, of course that would reduce the count significantly. However, there are 2 issues:

    1. Infinite recursion is hard to avoid when using anonymous functions, as MATLAB doesn't have a ternary operator to offer a break condition. Bodging a ternary operator of sorts (see below) also costs bytes as we need the condition twice.

    2. You have to pass an anonymous function to itself if it is recursive (see here) which adds bytes.

    The closest I came to this used the following lines, perhaps it can be changed to work:

    % Condition, since we need to use it twice 
    c=@(n)n>1&&~isprime(n);
    % This uses a bodged ternary operator, multiplying the two possible outputs by
    % c(n) and ~c(n) and adding to return effectively only one of them
    % An attempt was made to use &&'s short-circuiting to avoid infinite recursion
    % but this doesn't seem to work!
    S=@(S,n,k)~c(n)*k+c(n)&&S(S,nnz(primes(n)),k+1);
\$\endgroup\$
0
6
\$\begingroup\$

MATLAB - 126 121* bytes

I attempted a more vectorized approach than Adriaan and was able to shave more bytes off. Here's the single-line solution:

function t(n),M=1:n^2;c=0;i=1;s=@isprime;v=cumsum(s(M));while any(i),i=M>1&~s(M);c=c+i;M(i)=v(M(i));end;imagesc(c(spiral(n)))

And here's the nicely-formatted solution:

function t(n),
  M = 1:n^2;
  c = 0;
  i = 1;
  s = @isprime;
  v = cumsum(s(M));
  while any(i),         % *See below
    i = M > 1 & ~s(M);
    c = c+i;
    M(i) = v(M(i));
  end;
  imagesc(c(spiral(n)))

*Note: if you're willing to allow a metric crapton of unnecessary iterations, you can change the line while any(i), to for m=v, and save 5 bytes.

\$\endgroup\$
4
  • \$\begingroup\$ Nice! I like how you use cumsum to vectorize and avoid nnz(primes(...) \$\endgroup\$
    – Luis Mendo
    Commented Jan 31, 2018 at 17:56
  • 1
    \$\begingroup\$ If I understand correctly, it doesn't hurt to iterate more times than necessary (at the cost of speed). So you can replace while any(i) by for m=M. Who cares if the code takes hours to run :-) \$\endgroup\$
    – Luis Mendo
    Commented Jan 31, 2018 at 18:01
  • 2
    \$\begingroup\$ @LuisMendo: Sure, why not? It already iterates once more than needed, what's another n^2 or so iterations gonna hurt! ;) \$\endgroup\$
    – gnovice
    Commented Jan 31, 2018 at 18:08
  • 1
    \$\begingroup\$ That's the spirit! You can also keep the faster-running version, but the byte count is that of the shorter \$\endgroup\$
    – Luis Mendo
    Commented Jan 31, 2018 at 19:03
3
+200
\$\begingroup\$

Dyalog APL, 94 bytes

'P2'
2⍴n←⎕
9
(⍪0){×≢⍵:(≢⍺)((⍉∘⌽⍺,↑)∇↓)⍵⋄⍺}2↓{⍵⌊1+⍵[+\p]}⍣≡9×~p←1=⊃+/(≠⍨,≠⍨,~⍴⍨(×⍨n)-2×≢)¨,\×⍳n

assumes ⎕IO=0

output for n=701 (converted from .pgm to .png):

enter image description here

\$\endgroup\$
2
\$\begingroup\$

Python 3, 299 265 bytes

Saved 5 bytes thanks to formatting suggestions from Jonathan Frech and NoOneIsHere. Removed an additional 34 bytes by removing a function definition that was only called once.

This is a little longer than some others, due to python not having a command to determine primeness, or spiral an array. It runs relatively quickly however, around a minute for n = 700.

from pylab import*
def S(n):
 q=arange(n*n+1);t=ones_like(q)
 for i in q[2:]:t[2*i::i]=0
 c=lambda i:0 if t[i]else 1+c(sum(t[2:i]));S=[c(x)for x in q]
 t=r_[[[S[1]]]]
 while any(array(t.shape)<n):m=t.shape;i=multiply(*m)+1;t=vstack([S[i:i+m[0]],rot90(t)])
 return t

Test it with

n = 7
x = S(n)
imshow(x, interpolation='none')
colorbar()
show(block=False)
\$\endgroup\$
2
  • 1
    \$\begingroup\$ Possible 294 bytes (untested). \$\endgroup\$ Commented Feb 3, 2018 at 21:02
  • 1
    \$\begingroup\$ One quick thing: you can remove the space between import and *. \$\endgroup\$ Commented Feb 3, 2018 at 21:19
2
\$\begingroup\$

J, 121 Bytes

load 'viewmat'
a=:3 :'viewmat{:@((p:inv@{.,>:@{:)^:(-.@((=1:)+.1&p:)@{.)^:_)@(,0:)"0(,1+(i.@#+>./)@{:)@|:@|.^:(+:<:y),.1'

Defines a function:

a=:3 :'viewmat{:@((p:inv@{.,>:@{:)^:(-.@((=1:)+.1&p:)@{.)^:_)@(,0:)"0(,1+(i.@#+>./)@{:)@|:@|.^:(+:<:y),.1' | Full fuction
                                                                     (,1+(i.@#+>./)@{:)@|:@|.^:(+:<:y),.1  | Creates the number spiral
              {:@((p:inv@{.,>:@{:)^:(-.@((=1:)+.1&p:)@{.)^:_)@(,0:)"0                                      | Applies S(n) to each element
       viewmat                                                                                             | View the array as an image
\$\endgroup\$
2
\$\begingroup\$

R, 231 bytes

function(n){p=function(n)sum(!n%%2:n)<2;M=matrix(0,n,n);M[n^2%/%2+cumsum(c(1,head(rep(rep(c(1,-n,-1,n),l=2*n-1),rev(n-seq(n*2-1)%/%2)),-1)))]=sapply(1:(n^2),function(x){y=0;while(x>2&!p(x)){x=sum(sapply(2:x,p));y=y+1};y});image(M)}

Slightly less golfed:

function(n){
    p=function(n)sum(!n%%2:n)<2 #"is.prime" function
    M=matrix(0,n,n)             #empty matrix
    indices=n^2%/%2+cumsum(c(1,head(rep(rep(c(1,-n,-1,n),l=2*n-1),rev(n-seq(n*2-1)%/%2)),-1)))
    values=sapply(1:(n^2),function(x){
        y=0
        while(x>2&!p(x)){
            x=sum(sapply(2:x,p))
            y=y+1
            }
        y})
    M[indices]=values
    image(M) #Plotting
}

Anonymous function. Output in a graphic window. Scale is on the red-scale with darkest shade equals to 0 and clearer shades increasing values.

Result for n=101:

n=101

\$\endgroup\$

Your Answer

By clicking “Post Your Answer”, you agree to our terms of service and acknowledge you have read our privacy policy.

Not the answer you're looking for? Browse other questions tagged or ask your own question.