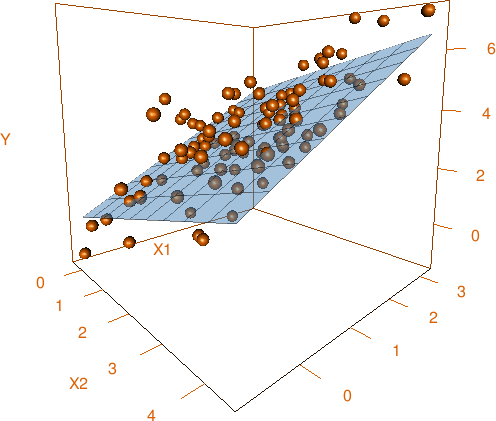
I am quite surprised that a variant of linear regression has been proposed for a challenge, whereas an estimation via ordinary least squares regression has not, despite the fact the this is arguably the most widely used method in applied economics, biology, psychology, and social sciences!
For details, check out the Wikipedia page on OLS. To keep things concise, suppose one has a model:
$$Y=\beta_0+\beta_1X_1+\beta_2X_2+\dots+\beta_kX_k+U$$
where all right-hand side X variables—regressors—are linearly independent and are assumed to be exogenous (or at least uncorrelated) to the model error U. Then you solve the problem
$$\min_{\beta_0,\dots,\beta_k}\sum_{i=1}^n\left(Y_i-\beta_0-\beta_1X_1-\dots-\beta_kX_k\right)^2$$
on a sample of size n, given observations
$$\left(\begin{matrix}Y_1&X_{1,1}&\cdots&X_{k,1}\\\vdots&\vdots&\ddots&\vdots\\Y_n&X_{1,n}&\cdots&X_{k,n}\end{matrix}\right)$$
The OLS solution to this problem as a vector looks like
$$\hat{\beta}=(\textbf{X}'\textbf{X})^{-1}(\textbf{X}'\textbf{Y})$$
where Y is the first column of the input matrix and X is a matrix made of a column of ones and remaining columns. This solution can be obtained via many numerical methods (matrix inversion, QR decomposition, Cholesky decomposition etc.), so pick your favourite!
Of course, econometricians prefer slightly different notation, but let’s just ignore them.
Non other than Gauss himself is watching you from the skies, so do not disappoint one of the greatest mathematicians of all times and write the shortest code possible.
Task
Given the observations in a matrix form as shown above, estimate the coefficients of the linear regression model via OLS.
Input
A matrix of values. The first column is always Y[1], ..., Y[n], the second column is X1[1], ..., X1[n], the next one is X2[1], ..., X2[n] etc. The column of ones is not given (as in real datasets), but you have to add it first in order to estimate beta0 (as in real models).
NB. In statistics, regressing on a constant is widely used. This means that the model is Y = b0 + U, and the OLS estimate of b0 is the sample average of Y. In this case, the input is just a matrix with one column, Y, and it is regressed on a column of ones.
You can safely assume that the variables are not exactly collinear, so the matrices above are invertible. In case your language cannot invert matrices with condition numbers larger than a certain threshold, state it explicitly, and provide a unique return value (that cannot be confused with output in case of success) denoting that the system seems to be computationally singular (S or any other unambiguous characters).
Output
OLS estimates of beta_0, ..., beta_k from a linear regression model in an unambiguous format or an indication that your language could not solve the system.
Challenge rules
- I/O formats are flexible. A matrix can be several lines of space-delimited numbers separated by newlines, or an array of row vectors, or an array of column vectors etc.
- This is code-golf, so shortest answer in bytes wins.
- Built-in functions are allowed as long as they are tweaked to produce a solution given the input matrix as an argument. That is, the two-byte answer
lmin R is not a valid answer because it expects a different kind of input. - Standard rules apply for your answer, so you are allowed to use STDIN/STDOUT, functions/method with the proper parameters and return-type, full programs.
- Default loopholes are forbidden.
Test cases
[[4,5,6],[1,2,3]]→ output:[3,1]. Explanation: X = [[1,1,1], [1,2,3]], X'X = [[3,6],[6,14]], inverse(X'X) = [[2.333,-1],[-1,0.5]], X'Y = [15, 32], and inverse(X'X)⋅X'Y=[3, 1][[5.5,4.1,10.5,7.7,6.6,7.2],[1.9,0.4,5.6,3.3,3.8,1.7],[4.2,2.2,3.2,3.2,2.5,6.6]]→ output:[2.1171050,1.1351122,0.4539268].[[1,-2,3,-4],[1,2,3,4],[1,2,3,4.000001]]→ output:[-1.3219977,6657598.3906250,-6657597.3945312]orS(any code for a computationally singular system).[[1,2,3,4,5]]→ output:3.
Bonus points (to your karma, not to your byte count) if your code can solve very ill-conditioned (quasi-multicollinear) problems (e. g. if you throw in an extra zero in the decimal part of X2[4] in Test Case 3) with high precision.
For fun: you can implement estimation of standard errors (White’s sandwich form or the simplified homoskedastic version) or any other kind of post-estimation diagnostics to amuse yourself if your language has built-in tools for that (I am looking at you, R, Python and Julia users). In other words, if your language allows to do cool stuff with regression objects in few bytes, you can show it!


lmin R is not a valid answer because it expects a different kind of input. \$\endgroup\$as.data.frame(matrix(c(Y,X1,...),n))wherenindicates the number of observations. \$\endgroup\$[4,5,6]a column or a row? \$\endgroup\$