26
\$\begingroup\$

Golf a Venn Diagram generator

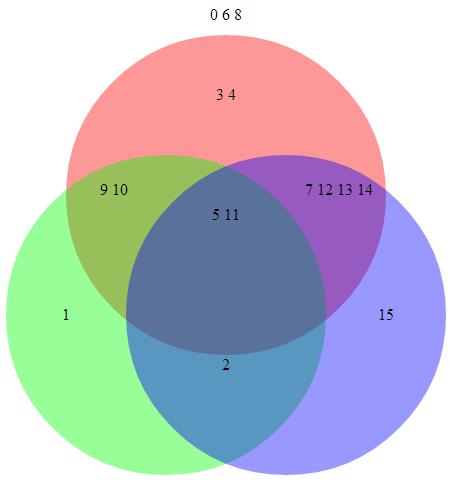
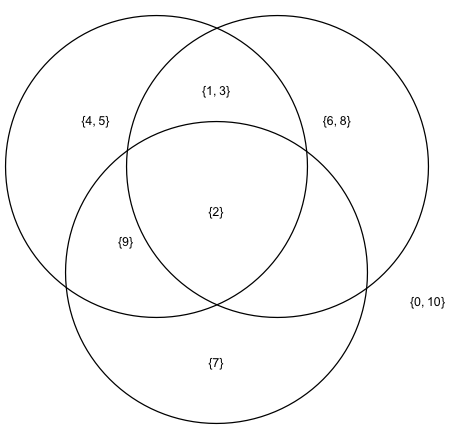
enter image description here

In order to properly celebrate John Venn's 180th birthday, today your task will be creating a program that outputs a Venn Diagram!

Input:

A positive integer N that will define the range of numbers appearing in the diagram (From zero to N) and three sets of positive integers.

Output:

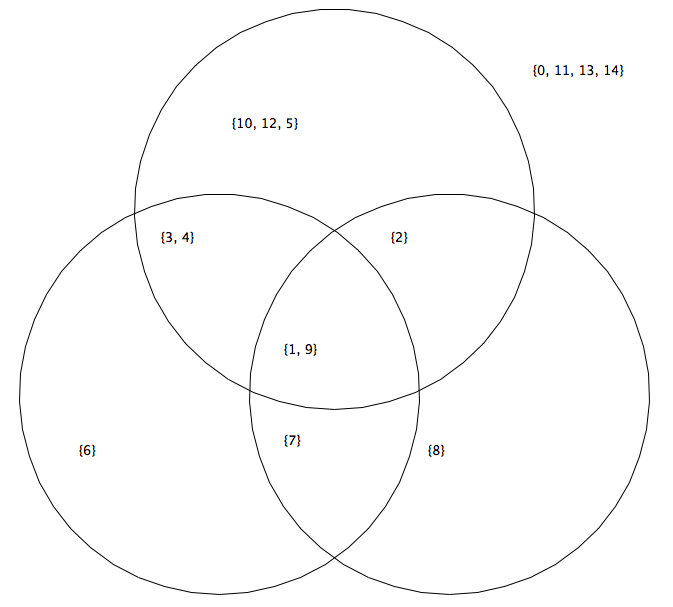
A 3 set Venn diagram showing all integers from 0 to N and the relationships of the sets by displaying them in the proper regions of the diagram, similar to this one.

Notes

  1. Use stdin (or whatever your language's equivalent is) to get the values.
  2. You can define the input format for the sets and for N (Separated by comma, slash or whatever works best for you).
  3. Numbers that do not appear in any of the sets but are within the specified range must appear on the diagram, just not inside any region.
  4. The sets don't need to be named.
  5. The output can be a drawing or ascii-art.
  6. The diagram can have any shape as long as the boundaries are unambiguously distinguishable (if you chose ASCII art, using + (or similar) for crossing boundaries is essential, for example).
  7. The regions may but don't have to be shaded.
  8. Any built-in functions or third party libraries that generate Venn Diagrams are disallowed.
  9. Standard loopholes apply.

This is , so the shortest code, in bytes, wins.

\$\endgroup\$
5
  • \$\begingroup\$ It looks like you should have added a note that solutions have to scale for arbitrary input sizes. Currently only a few of them do that (as far as I can tell only the ASCII ones). I don't like changing rules after the contest has started, but without this requirement, someone could probably really abuse it with a simple layout that only works for one character in each set (if I did that I'd probably cut the code size to a third or so). \$\endgroup\$ Commented Aug 5, 2014 at 9:24
  • \$\begingroup\$ @MartinBüttner Yeah, some of them scale pretty bad. But adding a note now that there are 7 answers seems like a bad idea. Should add the note and them comment on everyone's post to let them know that the diagram should scale well up to X? \$\endgroup\$ Commented Aug 5, 2014 at 10:54
  • \$\begingroup\$ Setting a limit will still allow just hard-coding that limit. I think that proper scaling is actually the most difficult part of the challenge. So either leave it as it is, or change it to say that it must deal with arbitrary set sizes (which technically isn't even a change, since you didn't limit the input sizes I think arbirtrary input sizes should be assumed anyway). \$\endgroup\$ Commented Aug 5, 2014 at 10:58
  • \$\begingroup\$ @Ryan Note that I state "by displaying them in the proper regions of the diagram" in the output section. Some answers (yours included) don't display the innermost section correctly if said section has more than 5 elements, so I think it's invalid \$\endgroup\$ Commented Aug 5, 2014 at 11:35
  • \$\begingroup\$ Relevant xkcd: xkcd.com/1810 \$\endgroup\$
    – sergiol
    Commented Apr 28, 2017 at 21:50

9 Answers 9

45
\$\begingroup\$

Ruby, 654 590 566 542 505 bytes

This was fun. I used ASCII. I wasn't able to test every possible combination yet, so if you find a glitchy test case, please let me know.

require'set'
u=(0..gets.to_i).to_set
a,b,c=eval(gets).map &:to_set
i=' '
m,M,n,N,o,O,p,P,q,Q,r,R,s,S=[a-b-c,b-a-c,c-a-b,a&b-c,b&c-a,a&c-b,a&b&c].map{|u|[t=u.to_a*i,t.size]}.flatten
H,V,X=?─,?│,?┼
puts'┌'+H*(A=[1+M+[P,S].max,1+R].max)+?┐+(u-a-b-c).to_a*i,V+i*M+?┌+(b=H*(T=-M+U=A-1)+X+H*(B=[N,Q].max))+?┐,V+m+V+p+i*(T-P)+V+n+i*(B-N)+V,'│┌'+H*(K=M-1)+X+b+X+H*(C=[O-B-1,0].max)+?┐,(v=V*2+i*K)+V+s+i*(T-S)+V+q+i*(B-Q)+V+i*C+V,v+?└+b+?┘+i*C+V,V*2+r+i*(U-R)+V+o+i*(-O+D=B+C+1)+V,'└┼'+H*U+?┘+i*D+V,' └'+H*(A+D)+?┘

It expects the input on STDIN in the following format

10
[[1,2,3,4,5,9],[1,2,3,6,8],[7,2,9]]

And will then reward you with this beauty

┌───────┐0 10
│   ┌───┼───┐
│4 5│1 3│6 8│
│┌──┼───┼───┼┐
││  │2  │   ││
││  └───┼───┘│
││9     │7   │
└┼──────┘    │
 └───────────┘

I don't think I can be bothered to add an ungolfed version. Please have a look at the original version in the edit history for a somewhat more readable version.

This could certainly be golfed further by making the set boundaries less tight or even keeping them fixed like some of the graphical ones do, but I prefer that it looks nice and is done "properly" despite being golfed.

\$\endgroup\$
5
  • \$\begingroup\$ If you hadn't reach today's cap you'd reach the 10K club today with this answer, what a pity \$\endgroup\$ Commented Aug 4, 2014 at 20:58
  • \$\begingroup\$ @WilliamBarbosa Maybe it'll give me the necessary upvotes tomorrow. ;) \$\endgroup\$ Commented Aug 4, 2014 at 20:58
  • \$\begingroup\$ That's a nice looking Venn diagram. I'm guessing the appearance of the diagram is the main reason for all you upvotes. What happens for larger sets? I'm guessing it stays the same height and just gets wider and wider? \$\endgroup\$ Commented Aug 4, 2014 at 23:03
  • \$\begingroup\$ @steveverrill yes exactly. each of the 8 subsets is just printed as a space delimited list in the right position. the boundaries are always the same shape, and each section's width is determined to be the minimum possible to fit everything inside. of course, it might look nicer if I computed line break to keep each subset roughly square, but then again this is code-golf after all ;). also it looks even better without the additional spacing between lines \$\endgroup\$ Commented Aug 4, 2014 at 23:10
  • 1
    \$\begingroup\$ Saw the little angle characters and did a double-take, thinking it was APL or something. :) \$\endgroup\$ Commented Aug 5, 2014 at 23:53
15
\$\begingroup\$

BBC BASIC, 243 ASCII characters (tokenised file size 211 bytes)

Download emulator at http://www.bbcbasic.co.uk/bbcwin/bbcwin.html

Golfed

  INPUT"N",n
  DIMs(n+1)
  FORi=0TO2PRINT"S";i
  REPEATINPUTx:s(x)=s(x)+2^i:UNTILx>n
  NEXTMODE4r=360CIRCLE460,r,r
  CIRCLE640,664,r
  CIRCLE820,r,r
  FORi=0TO7FORx=0TOn:IFs(x)=i PRINT;x
  NEXTREADa
  VDU28,a+1792;a+5;
  NEXT
  DATA19,4873,2572,4893,2586,5907,3091,34

BBC Basic is very arbitrary about which newlines/whitespace you can eliminate. Apart from stripping out unnecessary newlines there's another trick here that's not in the ungolfed version: I assign the viewport (see explanation below in ungolfed comments) at the END of the plotting loop, not at the beginning. This means that the elements outside the set are plotted the top left, and the cursor is trapped in a viewport at top right at the end of the program. The reason for this is to eliminate the VDU26.

Ungolfed

Each set of numbers is terminated by the user entering the number N+1 (a slightly unusual choice, this is to avoid errors caused by trying to write outside the range of an array.) Then it changes from a text mode to a graphics mode and plots the Venn diagram.

The input data is stored in an array, one cell for each value to be displayed. The data is stored as a 3-bit value: 1 for Set0 + 2 for Set1 + 4 for Set2 giving a number in the range 0 to 7. BBC basic has no shift operator, so the power operator is used instead: 2^i instead of 1<<i in C for example.

After plotting the circles, an outer loops goes through each of the eight regions, moving to the required coordinates (as per a data table.) An inner loop prints all the numbers in that region (those with the corresponding 3-bit value in the array.)

  INPUT"N",n                                 :REM create an array called s() with range 0..n+1
  DIMs(n+1)
  FORi=0TO2
    PRINT"S";i                               :REM prompt the user for data for set 0, set 1 and set 2.
    REPEATINPUTx:s(x)=s(x)+2^i:UNTILx>n      :REM input numbers and store as a bit table. Repeat until user enters n+1.
  NEXT
  MODE4                                      :REM change to graphics mode.
  r=360
  CIRCLE460,r,r                              :REM plot a circle at x,y,r.
  CIRCLE640,664,r                            :REM for the bottom two circles y=r.
  CIRCLE820,r,r
  FORi=0TO7                                  :REM for each region of the venn diagram
    READa                                    :REM read a 2 byte value for the  coordinates of the top left corner of a text viewport from the DATA statement: x+256y
    VDU28,a+1792;a+5;                        :REM create a 5x7 viewport (limits each region to 7 numbers.) 1792=7*256
    FORx=0TOn:IFs(x)=i PRINT;x               :REM print all numbers in the array belonging to that region
    NEXT
  NEXT
  VDU26                                      :REM Restore the viewport to the whole screen, to ensure the command prompt does not mess up the display at the end of the program.
  DATA34,19,4873,2572,4893,2586,5907,3091

Montage of typical input and output (ungolfed version)

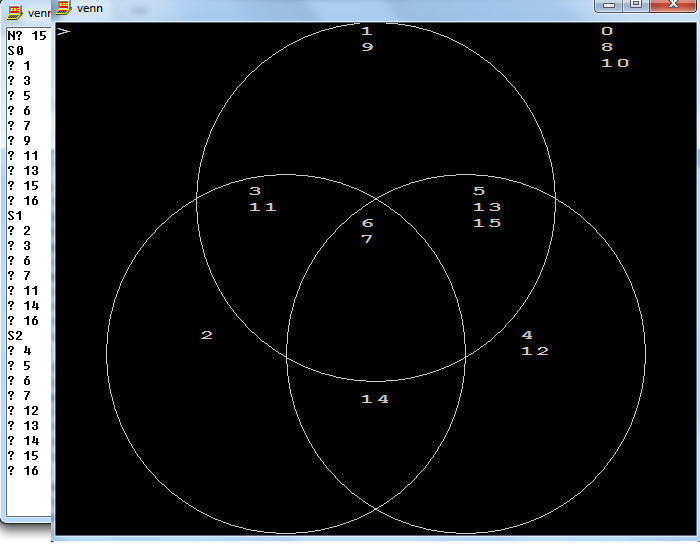
In the golfed version, the position of the numbers outside the sets is exchanged with the command prompt >.

enter image description here

\$\endgroup\$
4
  • \$\begingroup\$ Does this work for arbitrarily large inputs? \$\endgroup\$ Commented Aug 4, 2014 at 22:35
  • \$\begingroup\$ @MartinBüttner in principle yes the algorithm can do it, but the display lets it down (as is likely to be the problem with other solutions.) I hint in the program comments that each region is limited to 7 numbers before it begins to scroll (the numbers are in a vertical column as I thought wrapping would look horrible.) The emulator I am using can handle much higher screen resolutions, but I have gone for one of the "authentic" BBC micro screen modes which is quite limiting. If someone ports this to Java, the only practical limit will be the human ability to read the diagram. \$\endgroup\$ Commented Aug 4, 2014 at 22:48
  • \$\begingroup\$ Ah yeah, I was just wondering whether the circles would adapt to the input size... of course my solution will also be unreadable for large inputs if your terminal wraps the lines, but as long as it's displayed with scrollbars it can handle any input size. \$\endgroup\$ Commented Aug 4, 2014 at 22:53
  • 2
    \$\begingroup\$ even if this was ported to java you'd have to add code to make the circles bigger for more text \$\endgroup\$
    – Sparr
    Commented Aug 5, 2014 at 1:05
14
\$\begingroup\$

Javascript 1235

http://jsfiddle.net/44a4L/7/

Tested in google chrome v36.

Input is taken in the variables upper, set1, set2 and set3.

Update: Now automatically scales depending on the size of input.

function t(e,t){z.getElementById(e).innerHTML+=" "+t}z=document;s=200+upper*20;z.body.innerHTML+="<style>#m{width:"+s+"px;height:"+s+"px;}div{position:absolute;text-align:center;border-radius:50%;}#s1{left:calc(15% + 15px);top:30px;bottom:30%;right:calc(15% + 15px);background-color:rgba(255,0,0,0.4);padding:10%;}#s2{left:30px;bottom:30px;top:30%;right:30%;background-color:rgba(0,255,0,0.4);padding-right:40%;padding-top:30%;}#s3{right:30px;bottom:30px;top:30%;left:30%;background-color:rgba(0,0,255,0.4);padding-left:40%;padding-top:30%;}#s123{left:40%;top:40%;right:40%;bottom:40%;}#s12{left:20%;top:35%;right:65%;bottom:50%;}#s13{right:20%;top:35%;left:65%;bottom:50%;}#s23{left:40%;right:40%;bottom:15%;top:70%;}</style><div id=m><div id=s1 class=s></div><div id=s2 class=s></div><div id=s3 class=s></div><div id=s123 class=v></div><div id=s12 class=v></div><div id=s13 class=v></div><div id=s23 class=v></div></div>";for(i=0;i<=upper;i++){i1=i2=i3=false;if(set1.indexOf(i)!=-1)i1=true;if(set2.indexOf(i)!=-1)i2=true;if(set3.indexOf(i)!=-1)i3=true;if(i1&&i2&&i3)t("s123",i);else if(i1&&i2)t("s12",i);else if(i1&&i3)t("s13",i);else if(i2&&i3)t("s23",i);else if(i1)t("s1",i);else if(i2)t("s2",i);else if(i3)t("s3",i);else t("m",i)}

Sample output:

Venn

\$\endgroup\$
4
  • \$\begingroup\$ Pretty nice! I was able to squeeze it a bit tighter, see jsfiddle.net/44a4L/2 - look at the "t" function, CSS and body.innerHTML. Same logic though. I'm sure it could still be squeezed. \$\endgroup\$ Commented Aug 5, 2014 at 5:35
  • \$\begingroup\$ This is the most beautiful one so far, it's a pity it doesn't scale well. Three elements inside the innermost area makes it break. Do you plan on making it scale somehow? \$\endgroup\$ Commented Aug 5, 2014 at 11:08
  • \$\begingroup\$ @WilliamBarbosa scaling is implemented now \$\endgroup\$
    – rdans
    Commented Aug 5, 2014 at 21:40
  • 2
    \$\begingroup\$ Gorgeous! Stunning! Spectacular! (Had to use more than one superlative because SE hates brevity.) \$\endgroup\$ Commented Aug 6, 2014 at 15:13
8
\$\begingroup\$

Mathematica 343 264

UnGolfed

m=Input[]; data=Input[];


(* The circles to represent set boundaries *)
{R1,R2,R3}=Circle[#,5]&/@{{-2,8.5},{2,8.5},{0,5}};

(*converts  {1,0,1} to base 10, ie, the number 5.
bool[x_]:=FromDigits[Boole[x],2]

(* determines the region in which each number from 0 to `m` resides *)
encode[num_]:=bool[Table[MemberQ[data[[k]],num],{k,3}]]

(*Centroid of each region; the first is a location for numbers in none of the three sets *)
points={{7,4},{0,2},{4,10},{3,6},{-4,10},{-3,6},{0,11},{0,7}}

(* Plots the venn diagram with numbers in regions *)
Graphics[{
Text@@@({#[[1]],points[[#[[2]]+1]]}&/@({#[[All,1]],#[[1,2]]}&/@GatherBy[{#,encode[#]}&/@Range[0,m],Last])),
Opacity[.1],R1,R2,R3
}]

Assuming 10 was input for m and {{1,2,3,4,5,9},{1,2,3,6,8},{7,2,9}} was input for d,

new venn diagram


Golfed 264

I was surprised that all of the computation could be carried out within the Graphics function itself. With the exception of the inputs, it is a one-liner.

m=Input[];d=Input[]
Graphics@{Text@@@({#[[1]],{{7,4},{0,2},{4,10},{3,6},{-4,10},{-3,6},{0,11},{0,7}}[[#[[2]]+1]]}&/@({#[[All,1]],#[[1,2]]}&/@GatherBy[{#,FromDigits[Boole[Table[d[[k]]~MemberQ~#,{k,3}]],2]}&/@Range[0,m],Last])),Circle[#,5]&/@{{-2,8.5},{2,8.5},{0,5}}}
\$\endgroup\$
3
  • \$\begingroup\$ +1 for the appearance of the circles. I'm surprised they look so good in grey. The scattering of the numbers is weird though. You're using RandomSample to pick the location? \$\endgroup\$ Commented Aug 5, 2014 at 9:46
  • \$\begingroup\$ Gray works because the opacity is 10%. RandomSample was used to pick the location. Once a location has been chosen, it is removed from the set of candidates for additional picks. I played around with other methods (e.g. employing the centroid of a sub-region, but didn't like the results). BTW, I like your approach to fitting labels. \$\endgroup\$
    – DavidC
    Commented Aug 5, 2014 at 9:58
  • \$\begingroup\$ To save characters, I switched to Circles, so the gray disks are gone. Most of the savings comes from the fact that all members of a region are plotted at the center of that region. \$\endgroup\$
    – DavidC
    Commented Aug 5, 2014 at 22:46
5
\$\begingroup\$

HTML + JavaScript (E6) 752 761

Input format: max set1 set2 set3 (each set is a comma separated list of numbers)

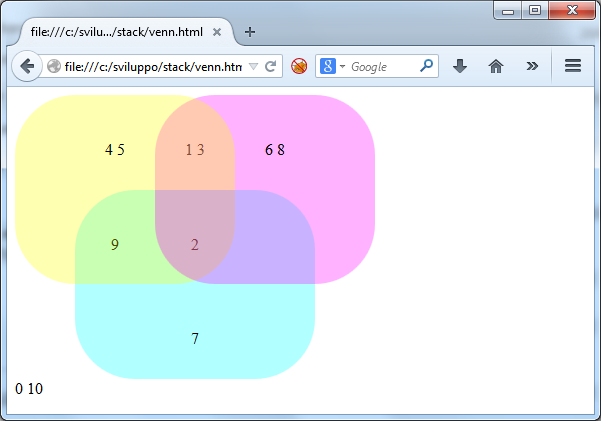
Example: 10 1,2,3,4,5,9 1,2,3,6,8 7,2,9

Screenshot

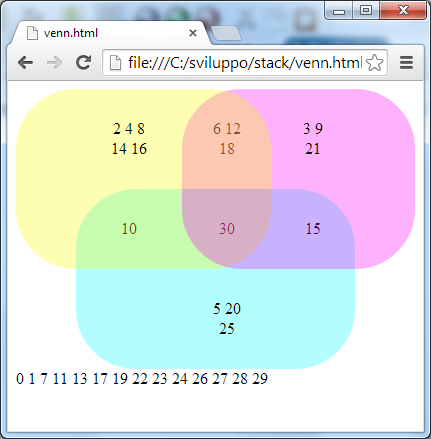
Example 2: 30 2,4,6,8,10,12,14,16,18,30 3,6,9,12,15,18,21,30 5,10,15,20,25,30

Chrome Screenshot

All the sections auto size thanks to html rendering.

<html><body><script>
i=prompt().split(' ');
r=",,,,,,,, class=',></i>".split(c=',')
for (j=-1;j++<i[0];r[h]+=j+' ')for(h=k=0;++k<4;)if((c+i[k]+c).search(c+j+c)+1)h+=k+(k>2);
document.write(
"<style>div{1row}p{position:relative;text-align:center;padding:7;1cell}i{position:absolute;top:0;3:0;4:0;left:0}.a{2top-left5b{2top-45c{23-left5d{23-45x{6880,9.y{680,89.z{60,889</style>"
.replace(/\d/g,x=>'09display:table-9border-9bottom9right9-radius:60px}.9background:rgba(930px9255,9.3)}'.split(9)[x])
+"<div><p8x a'/><p8x'>1</p><p><i8y a'9<i8x b'93</p><p8y'>2</p><p8y b'/></div><div><p8x c'/><p8z a'><i8x'95</p><p8z'><i8x d'9<i8y c'97</p><p8z b'><i8y'96</p><p8y d'/></div><div><p/><p8z c'/><p8z'>4</p><p8z d'/></div>0"
.replace(/\d/g,x=>r[x]))
</script></body></html>

Javascript E5 version Works in Chrome and MSIE 10 (maybe 9)

<html><body><script>
i=prompt().split(' ');
r=",,,,,,,, class=',></i>".split(c=',')
for (j=-1;j++<i[0];r[h]+=j+' ')for(h=k=0;++k<4;)if((c+i[k]+c).search(c+j+c)+1)h+=k+(k>2);
document.write(
"<style>div{1row}p{position:relative;text-align:center;padding:7;1cell}i{position:absolute;top:0;3:0;4:0;left:0}.a{2top-left5b{2top-45c{23-left5d{23-45x{6880,9.y{680,89.z{60,889</style>"
.replace(/\d/g,function(x){return '09display:table-9border-9bottom9right9-radius:60px}.9background:rgba(930px9255,9.3)}'.split(9)[x]})
+"<div><p8x a'/><p8x'>1</p><p><i8y a'9<i8x b'93</p><p8y'>2</p><p8y b'/></div><div><p8x c'/><p8z a'><i8x'95</p><p8z'><i8x d'9<i8y c'97</p><p8z b'><i8y'96</p><p8y d'/></div><div><p/><p8z c'/><p8z'>4</p><p8z d'/></div>0"
.replace(/\d/g,function(x){return r[x]}))
</script></body></html>
                           

Not (so) golfed

<html>
<style>
div {   display:table-row; }
p {
    position: relative;
    text-align: center;
    padding: 30px;
    display: table-cell;
}
i {
    position: absolute;
    top:0;bottom:0;right:0;left:0;
}
.a { border-top-left-radius: 60px; }
.b { border-top-right-radius: 60px; }
.c { border-bottom-left-radius: 60px; }
.d { border-bottom-right-radius: 60px; }
.x { background: rgba(255,255,0,.3) }
.y { background: rgba(255,0,255,.3) }
.z { background: rgba(0,255,255,.3) }
</style>
<body>
<div>
<p class='x a'/><p class='x'><b id='b1'></b></p><p><i class='y a'></i><i class='x b'></i><b id='b3'></b></p><p class='y'><b id='b2'></b></p><p class='y b'/>
</div>    
<div>
<p class='x c'/><p class='z a'><i class='x'></i><b id='b5'></b></p><p class='z'><i class='x d'></i><i class='y c'></i><b id='b7'></b></p><p class='z b'><i class='y'></i><b id='b6'></b></p><p class='y d'/>
</div>        
<div>
<p/><p class='z c'/><p class='z'><b id='b4'></b></p><p class='z d'/>
</div>    
<b id='b0'></b>    
<script>
i=prompt().split(' ')
r=',,,,,,,'.split(c=',')
for (j=-1; j++<i[0];)
{
    for(h = k = 0; ++k < 4;)
    {
    if( (c+i[k]+c).search(c+j+c) >= 0)
      h += k + (k>2); // bit mask 1 or 2 or 4
  }
  r[h] += j + ' ';
}        
for (j = 0; j < 8; j++)
    document.getElementById('b'+j).innerHTML=r[j]
</script>
</html>
\$\endgroup\$
4
\$\begingroup\$

Python - 603

import re
n,a,b,c=eval(input())
h=set(range(n+1))-a-b-c
g=a&b&c
d,e,f=a&b-g,b&c-g,a&c-g
l,m=set(a),set(b)
a-=b|c
b-=l|c
c-=l|m
for t in'abcdefgh':exec("%s=' '.join(map(str,%s))"%(2*(t,)))
l=len
x,y,z=max(l(a),l(f)+2,3),l(max(d,g)),max(l(b),l(e)+2,l(c)-l(f+g)-2,3)
j=[0]*4
for t in'abcdefg':exec("%s=%s.ljust([x,z,x+y+z-2,y,z-2,x-2,y][ord('%s')-97])+'|'"%(3*(t,)))
s='\d| '
w=re.sub
for r in (1,3):q=r//2;j[r]=['','| '][q]+'|'+[a+d+b,f+g+e][q]+['',' |'][q];j[r-1]=w('\|','+',w(s,'-',j[r]))
j[0]+=h
o=j[2]
j[2]='| +'+j[2][3:-3]+'+ |'
p='  |'+c
q='  '+w('\|','+',w(s,'-',p))[2:]
for l in j+[o,p,q]:print(l)

Input is N followed by the three sets, seperated by commas (e.g. 8, {1,2,4}, {2,3,4,5}, {4,6,8}). It outputs a set in ACSII art like the following:

+---+-+---+0 7
|1  | |3 5|
| +-+-+-+ |
| |2|4| | |
+-+-+-+-+-+
  |6 8  |
  +-----+
\$\endgroup\$
2
  • \$\begingroup\$ Haha, two nearly identical solutions within 5 minutes. (3 hours after the challenge was posted...) \$\endgroup\$ Commented Aug 4, 2014 at 20:30
  • 1
    \$\begingroup\$ Please refer to note number 6. Your edges and crossing boundaries need to be a different character, such as "+". \$\endgroup\$ Commented Aug 4, 2014 at 20:36
3
\$\begingroup\$

Python 3 - 353

# 353 bytes, input format like: 6 1,2,3 2,3,4 1,3,4
import sys
from turtle import*
_,n,*q=sys.argv
n=set(range(int(n)))
a,b,c=map(set,map(eval,q))
for x,y in(0,0),(-115,-185),(115,-185):goto(x,y),pd(),circle(200),up()
for x,y,s in(200,331,n-a-b-c),(-101,278,a-b-c),(-254,-49,b-a-c),(95,-49,c-a-b),(-172,164,a&b-c),(58,164,a&c-b),(-49,-39,b&c-a),(-49,52,a&b&c):goto(x,y),write(s or'',font=None)
ht()
done()

Did anybody else play with Logo as a kid?

Sample: python3 turtletest.py 15 1,2,3,4,5,9,10,12 1,3,4,6,7,9 1,2,7,8,9

enter image description here

\$\endgroup\$
3
  • \$\begingroup\$ will the font/circles scale for arbitrarily large input? \$\endgroup\$
    – Sparr
    Commented Aug 5, 2014 at 5:37
  • \$\begingroup\$ No, still thinking about that one. \$\endgroup\$
    – Jason S
    Commented Aug 5, 2014 at 5:39
  • \$\begingroup\$ @JasonS Still thinking? \$\endgroup\$ Commented Oct 2, 2018 at 21:19
3
\$\begingroup\$

perl 388b 346b 488b

This has output similar to another entry:

@a=split($",<>);
$n=pop @a;
@a=map[split(',')],@a;
for$i(0..2){$b{$_}+=1<<$i foreach@{$a[$i]}}
push@{$c[$b{$_}]},$_ for(0..$n);
$l|=length($d[$_]=join($",@{$c[$_]}))for(0..$n);
print$h=(("+-"."-"x$l)x3)."+
";
sub j{sprintf"% ".(sprintf"%ds",$l+($_[0]<4)+($_[0]==7)),$d[$_[0]]}
sub r{join('|',map{j($_)}@_)}
$h=~s/\+-/|+/;
$h=~s/-\+$/+|/;
print "|".r(1,3,2)."|
".$h;
$h=~s/[|+]{2}/++/g;
print "||".r(5,7,6)."||
".$h;
$h=~s/\+\+/ +/;
$h=~s/\+\+/+ /;
$h=~s/-\+-/---/g;
$l=$l*3+3;print " |".j(4)."|
",$h,$d[0]

Test run and output:

# echo "1,2,3,7,13 2,3,8,11,13,6,9 3,4,5,11,12,13,14 15" | perl venn.pl ;echo
+----------------+----------------+----------------+
|             1 7|               2|           6 8 9|
|+---------------+----------------+---------------+|
||               |            3 13|             11||
++---------------+----------------+---------------++
 |                                       4 5 12 14|
 +------------------------------------------------+ 
\$\endgroup\$
3
  • \$\begingroup\$ Hm, I'm not sure the layout is really unambiguous if you haven't seen the input. \$\endgroup\$ Commented Aug 5, 2014 at 9:22
  • \$\begingroup\$ You're right, this isn't venn-y enough \$\endgroup\$ Commented Aug 5, 2014 at 11:09
  • \$\begingroup\$ @WilliamBarbosa ok, I made it look like faubiguy's entry \$\endgroup\$
    – Sparr
    Commented Aug 5, 2014 at 13:50
2
\$\begingroup\$

T-SQL 2095

Assumes @N is an int containing N. Assumes @A, @B, and @C are tables containing the three sets of numbers. Didn't try to golf it too much.

DECLARE @D INT=@N,@E INT=0,@F CHAR='/',@G CHAR='\',@H CHAR='-',@I CHAR='|',@J CHAR='+'DECLARE @ TABLE(Z INT,Y INT,X INT,W INT,V INT,U INT,T INT,S INT)INSERT INTO @(Z)SELECT A.P FROM @A A JOIN @B B ON A.P=B.P JOIN @C C ON A.P=C.P INSERT INTO @(Y)SELECT A.P FROM @A A JOIN @B B ON A.P=B.P LEFT JOIN @C C ON A.P=C.P WHERE C.P IS NULL INSERT INTO @(X)SELECT C.P FROM @C C JOIN @A A ON C.P=A.P LEFT JOIN @B B ON C.P=B.P WHERE B.P IS NULL INSERT INTO @(W)SELECT B.P FROM @B B JOIN @C C ON B.P=C.P LEFT JOIN @A A ON B.P=A.P WHERE A.P IS NULL INSERT INTO @(V)SELECT A.P FROM @A A LEFT JOIN @B B ON A.P=B.P LEFT JOIN @C C ON A.P=C.P WHERE C.P IS NULL AND B.P IS NULL INSERT INTO @(U)SELECT C.P FROM @C C LEFT JOIN @A A ON C.P=A.P LEFT JOIN @B B ON C.P=B.P WHERE B.P IS NULL AND A.P IS NULL INSERT INTO @(T)SELECT B.P FROM @B B LEFT JOIN @C C ON B.P=C.P LEFT JOIN @A A ON B.P=A.P WHERE A.P IS NULL AND C.P IS NULL WHILE @N>=0BEGIN INSERT INTO @(S)SELECT @N WHERE @N NOT IN(SELECT*FROM @A UNION SELECT*FROM @B UNION SELECT*FROM @C)SET @N-=1 END DECLARE @Z TABLE(A CHAR(5),B CHAR(5),C CHAR(5),D CHAR(5),E CHAR(5),F CHAR(5),G CHAR(5),H CHAR(5))INSERT INTO @Z SELECT @F,@H,@F,@H,@G,@H,@G,''WHILE @E<=@D BEGIN INSERT INTO @Z SELECT @I,ISNULL((SELECT CONVERT(CHAR,@E,5) WHERE @E IN(SELECT V FROM @)),''),@I,ISNULL((SELECT CONVERT(CHAR,@E,5) WHERE @E IN(SELECT X FROM @)),''),@I,ISNULL((SELECT CONVERT(CHAR,@E,5) WHERE @E IN(SELECT U FROM @)),''),@I,ISNULL((SELECT CONVERT(CHAR,@E,5) WHERE @E IN(SELECT S FROM @)),'')SET @E+=1 END INSERT INTO @Z SELECT @F,@H,@J,@H,@G,'',@I,''SET @E=0WHILE @E<=@D BEGIN INSERT INTO @Z SELECT @I,ISNULL((SELECT CONVERT(CHAR,@E,5) WHERE @E IN(SELECT Y FROM @)),''),@I,ISNULL((SELECT CONVERT(CHAR,@E,5) WHERE @E IN(SELECT Z FROM @)),''),@I,'',@I,''SET @E+=1 END INSERT INTO @Z SELECT @G,@H,@J,@H,@F,'',@I,''SET @E=0WHILE @E<=@D BEGIN INSERT INTO @Z SELECT @I,ISNULL((SELECT CONVERT(CHAR,@E,5) WHERE @E IN(SELECT T FROM @)),''),@I,ISNULL((SELECT CONVERT(CHAR,@E,5) WHERE @E IN(SELECT W FROM @)),''),@I,'',@I,''SET @E+=1 END INSERT INTO @Z SELECT @G,@H,@G,@H,@F,@H,@F,''SELECT*FROM @Z

Less golfed version:

--finding the sets
DECLARE @D INT=@N,@E INT=0,@F CHAR='/',@G CHAR='\',@H CHAR='-',@I CHAR='|',@J CHAR='+'
DECLARE @ TABLE(Z INT,Y INT,X INT,W INT,V INT,U INT,T INT,S INT)
INSERT INTO @(Z)
SELECT A.P FROM @A A JOIN @B B ON A.P=B.P JOIN @C C ON A.P=C.P 
INSERT INTO @(Y)
SELECT A.P FROM @A A JOIN @B B ON A.P=B.P LEFT JOIN @C C ON A.P=C.P WHERE C.P IS NULL 
INSERT INTO @(X)
SELECT C.P FROM @C C JOIN @A A ON C.P=A.P LEFT JOIN @B B ON C.P=B.P WHERE B.P IS NULL 
INSERT INTO @(W)
SELECT B.P FROM @B B JOIN @C C ON B.P=C.P LEFT JOIN @A A ON B.P=A.P WHERE A.P IS NULL 
INSERT INTO @(V)
SELECT A.P FROM @A A LEFT JOIN @B B ON A.P=B.P LEFT JOIN @C C ON A.P=C.P WHERE C.P IS NULL AND B.P IS NULL 
INSERT INTO @(U)
SELECT C.P FROM @C C LEFT JOIN @A A ON C.P=A.P LEFT JOIN @B B ON C.P=B.P WHERE B.P IS NULL AND A.P IS NULL 
INSERT INTO @(T)
SELECT B.P FROM @B B LEFT JOIN @C C ON B.P=C.P LEFT JOIN @A A ON B.P=A.P WHERE A.P IS NULL AND C.P IS NULL 
WHILE @N>=0
BEGIN 
    INSERT INTO @(S)
    SELECT @N WHERE @N NOT IN(SELECT*FROM @A UNION SELECT*FROM @B UNION SELECT*FROM @C)
    SET @N-=1 
END

--displaying the venn diagram
DECLARE @Z TABLE(A CHAR(5),B CHAR(5),C CHAR(5),D CHAR(5),E CHAR(5),F CHAR(5),G CHAR(5),H CHAR(5))
INSERT INTO @Z 
SELECT @F,@H,@F,@H,@G,@H,@G,''
WHILE @E<=@D 
BEGIN 
    INSERT INTO @Z 
    SELECT @I,ISNULL((SELECT CONVERT(CHAR,@E,5) WHERE @E IN(SELECT V FROM @)),''),@I,ISNULL((SELECT CONVERT(CHAR,@E,5) WHERE @E IN(SELECT X FROM @)),''),@I,ISNULL((SELECT CONVERT(CHAR,@E,5) WHERE @E IN(SELECT U FROM @)),''),@I,ISNULL((SELECT CONVERT(CHAR,@E,5) WHERE @E IN(SELECT S FROM @)),'')
    SET @E+=1 
END 
INSERT INTO @Z 
SELECT @F,@H,@J,@H,@G,'',@I,''
SET @E=0
WHILE @E<=@D 
BEGIN 
    INSERT INTO @Z 
    SELECT @I,ISNULL((SELECT CONVERT(CHAR,@E,5) WHERE @E IN(SELECT Y FROM @)),''),@I,ISNULL((SELECT CONVERT(CHAR,@E,5) WHERE @E IN(SELECT Z FROM @)),''),@I,'',@I,''
    SET @E+=1 
END 
INSERT INTO @Z 
SELECT @G,@H,@J,@H,@F,'',@I,''
SET @E=0
WHILE @E<=@D 
BEGIN 
    INSERT INTO @Z 
    SELECT @I,ISNULL((SELECT CONVERT(CHAR,@E,5) WHERE @E IN(SELECT T FROM @)),''),@I,ISNULL((SELECT CONVERT(CHAR,@E,5) WHERE @E IN(SELECT W FROM @)),''),@I,'',@I,''
    SET @E+=1 
END 
INSERT INTO @Z 
SELECT @G,@H,@G,@H,@F,@H,@F,''
SELECT*FROM @Z
\$\endgroup\$

Your Answer

By clicking “Post Your Answer”, you agree to our terms of service and acknowledge you have read our privacy policy.

Not the answer you're looking for? Browse other questions tagged or ask your own question.