88
\$\begingroup\$

Your task is to write code that will leak at least one byte of memory in as few bytes as possible. The memory must be leaked not just allocated.

Leaked memory is memory that the program allocates but loses the ability to access before it can deallocate the memory properly. For most high level languages this memory has to be allocated on the heap.

An example in C++ would be the following program:

int main(){new int;}

This makes a new int on the heap without a pointer to it. This memory is instantly leaked because we have no way of accessing it.

Here is what a leak summary from Valgrind might look like:

LEAK SUMMARY:
   definitely lost: 4 bytes in 1 blocks
   indirectly lost: 0 bytes in 0 blocks
     possibly lost: 0 bytes in 0 blocks
   still reachable: 0 bytes in 0 blocks
        suppressed: 0 bytes in 0 blocks

Many languages have a memory debugger (such as Valgrind) if you can you should include output from such a debugger to confirm that you have leaked memory.

The goal is to minimize the number of bytes in your source.

\$\endgroup\$
11
  • 2
    \$\begingroup\$ Perhaps you could have different ranges of amount leaked and depending on how much you leak you lose x% of your byte count \$\endgroup\$
    – user63187
    Commented Feb 18, 2017 at 17:38
  • 11
    \$\begingroup\$ @ChristopherPeart For one I am not a fan of bonuses on challenges and for two as you have already shown it is very easy to leak unbounded memory. \$\endgroup\$
    – Wheat Wizard
    Commented Feb 18, 2017 at 18:01
  • 1
    \$\begingroup\$ Related. Not a duplicate, though, because most answers to that question form an infinite reachable structure in memory rather than actually leaking memory. \$\endgroup\$
    – user62131
    Commented Feb 18, 2017 at 18:18
  • 2
    \$\begingroup\$ what is the idea? That the mem cannot be freed? I guess this would require native execution for garbage collected languages or exploiting bugs. \$\endgroup\$ Commented Feb 18, 2017 at 21:26
  • 7
    \$\begingroup\$ I see how languages designed for golfing fail miserably on this one ... \$\endgroup\$
    – Kh40tiK
    Commented Feb 19, 2017 at 12:25

42 Answers 42

93
\$\begingroup\$

Perl (5.22.2), 0 bytes

Try it online!

I knew there'd be some language out there that leaked memory on an empty program. I was expecting it to be an esolang, but turns out that perl leaks memory on any program. (I'm assuming that this is intentional, because freeing memory if you know you're going to exit anyway just wastes time; as such, the common recommendation nowadays is to just leak any remaining memory once you're in your program's exit routines.)

Verification

$ echo -n | valgrind perl
…snip…
==18517== 
==18517== LEAK SUMMARY:
==18517==    definitely lost: 8,134 bytes in 15 blocks
==18517==    indirectly lost: 154,523 bytes in 713 blocks
==18517==      possibly lost: 0 bytes in 0 blocks
==18517==    still reachable: 0 bytes in 0 blocks
==18517==         suppressed: 0 bytes in 0 blocks
==18517== 
==18517== For counts of detected and suppressed errors, rerun with: -v
==18517== ERROR SUMMARY: 15 errors from 15 contexts (suppressed: 0 from 0)
\$\endgroup\$
9
  • 17
    \$\begingroup\$ I liked the Unlambda answer, but this one is (IMHO) too much of a stretch, as it is obviously the interpreter itself which leaks the memory, i.e. I get ` definitely lost: 7,742 bytes in 14 blocks` when I run perl --version on my machine, despite it never gets to running any program, at all. \$\endgroup\$
    – zeppelin
    Commented Feb 19, 2017 at 7:14
  • 12
    \$\begingroup\$ @zeppelin: Agreed, but according to our rules, it's the implementation that defines the language, thus if the implementation leaks memory, all programs in the language leak memory. I'm not necessarily sure I agree with that rule, but at this point it's too entrenched to really be able to change. \$\endgroup\$
    – user62131
    Commented Feb 19, 2017 at 9:03
  • 9
    \$\begingroup\$ This also works in Node JS. \$\endgroup\$
    – Dennis
    Commented Feb 19, 2017 at 18:40
  • 7
    \$\begingroup\$ This feels like a new standard loophole in the making... \$\endgroup\$ Commented Feb 22, 2017 at 3:32
  • 56
    \$\begingroup\$ Finally a Perl script that I can understand. \$\endgroup\$
    – user11153
    Commented Feb 22, 2017 at 16:05
69
\$\begingroup\$

C, 48 31 22 bytes

Warning: Don't run this too many times.

Thanks to Dennis for lots of help/ideas!

f(k){shmget(k,1,512);}

This goes one step further. shmget allocates shared memory that isn't deallocated when the program ends. It uses a key to identify the memory, so we use an uninitialized int. This is technically undefined behaviour, but practically it means that we use the value that is just above the top of the stack when this is called. This will get written over the next time that anything is added to the stack, so we will lose the key.


The only case that this doesn't work is if you can figure out what was on the stack before. For an extra 19 bytes you can avoid this problem:

f(){srand(time(0));shmget(rand(),1,512);}

Or, for 26 bytes:

main(k){shmget(&k,1,512);}

But with this one, the memory is leaked after the program exits. While running the program has access to the memory which is against the rules, but after the program terminates we lose access to the key and the memory is still allocated.  This requires address space layout randomisation (ASLR), otherwise &k will always be the same. Nowadays ASLR is typically on by default.


Verification:

You can use ipcs -m to see what shared memory exists on your system. I removed pre-existing entries for clarity:

$ cat leakMem.c 
f(k){shmget(k,1,512);}
int main(){f();}     
$ gcc leakMem.c -o leakMem
leakMem.c:1:1: warning: return type defaults to ‘int’ [-Wimplicit-int]
 f(k){shmget(k,1,512);}
 ^
leakMem.c: In function ‘f’:
leakMem.c:1:1: warning: type of ‘k’ defaults to ‘int’ [-Wimplicit-int]
leakMem.c:1:6: warning: implicit declaration of function ‘shmget’ [-Wimplicit-function-declaration]
 f(k){shmget(k,1,512);}
ppcg:ipcs -m

------ Shared Memory Segments --------
key        shmid      owner      perms      bytes      nattch     status      


$ ./leakMem 

$ ipcs -m

------ Shared Memory Segments --------
key        shmid      owner      perms      bytes      nattch     status      

0x0000007b 3375157    Riley      0          1          0  
\$\endgroup\$
20
  • 1
    \$\begingroup\$ @AndrewSavinykh Theoretically, the shmid could have been stored in a file and a program could attach to it in the future. This is how unix shared memory works... \$\endgroup\$
    – tbodt
    Commented Feb 18, 2017 at 22:07
  • 1
    \$\begingroup\$ @AndrewSavinykh Shared memory basically becomes a resource that the OS can give to other processes. It is similar to a file that lives in RAM and any process that knows the name (key) has access to it until it is deleted. Imagine a process that calculates a number and stores it in memory and exits before the process that reads the data connects to the shared memory. In this case, if the OS frees the memory then the second process can't get it. \$\endgroup\$
    – Riley
    Commented Feb 18, 2017 at 22:27
  • 38
    \$\begingroup\$ Thank you for posting this. I just protected TIO against shared memory leaks. \$\endgroup\$
    – Dennis
    Commented Feb 18, 2017 at 23:30
  • 4
    \$\begingroup\$ @Dennis That's why I didn't post a TIO link. I didn't know if it was protected or not. \$\endgroup\$
    – Riley
    Commented Feb 18, 2017 at 23:31
  • 15
    \$\begingroup\$ I like how you use the word problem to describe the scenario where the program leaks less memory than intended. \$\endgroup\$
    – kasperd
    Commented Feb 19, 2017 at 14:24
43
\$\begingroup\$

Unlambda (c-refcnt/unlambda), 1 byte

i

Try it online!

This is really a challenge about finding a pre-existing interpreter which leaks memory on very simple programs. In this case, I used Unlambda. There's more than one official Unlambda interpreter, but c-refcnt is one of the easiest to build, and it has the useful property here that it leaks memory when a program runs successfully. So all I needed to give here was the simplest possible legal Unlambda program, a no-op. (Note that the empty program doesn't work here; the memory is still reachable at the time the interpreter crashes.)

Verification

$ wget ftp://ftp.madore.org/pub/madore/unlambda/unlambda-2.0.0.tar.gz
…snip…
2017-02-18 18:11:08 (975 KB/s) - ‘unlambda-2.0.0.tar.gz’ saved [492894]
$ tar xf unlambda-2.0.0.tar.gz 
$ cd unlambda-2.0.0/c-refcnt/
$ gcc unlambda.c
$ echo -n i | valgrind ./a.out /dev/stdin
…snip…
==3417== LEAK SUMMARY:
==3417==    definitely lost: 40 bytes in 1 blocks
==3417==    indirectly lost: 0 bytes in 0 blocks
==3417==      possibly lost: 0 bytes in 0 blocks
==3417==    still reachable: 0 bytes in 0 blocks
==3417==         suppressed: 0 bytes in 0 blocks
==3417== 
==3417== For counts of detected and suppressed errors, rerun with: -v
==3417== ERROR SUMMARY: 1 errors from 1 contexts (suppressed: 0 from 0)
\$\endgroup\$
42
\$\begingroup\$

TI-Basic, 12 bytes

While 1
Goto A
End
Lbl A
Pause 

"... a memory leak is where you use a Goto/Lbl within a loop or If conditional (anything that has an End command) to jump out of that control structure before the End command is reached... " (more)

\$\endgroup\$
8
  • 2
    \$\begingroup\$ Yep, most of us know the feeling ;) @RayKoopa \$\endgroup\$
    – Timtech
    Commented Feb 19, 2017 at 2:44
  • 13
    \$\begingroup\$ +1 for Ti Basic. I spent most of my 9th grade year programming those things. \$\endgroup\$ Commented Feb 19, 2017 at 3:26
  • \$\begingroup\$ Do you need Pause at the end? You could save 2 bytes. \$\endgroup\$
    – kamoroso94
    Commented Feb 19, 2017 at 5:23
  • \$\begingroup\$ @kamoroso94 I think so, because "If a program is ended the leak is cleared and will cause no further issues", so it is to stop the program from ending. \$\endgroup\$
    – Timtech
    Commented Feb 19, 2017 at 15:24
  • \$\begingroup\$ A simpler "leak" under these rules would be to create a program named prgmA consisting of the single command prgmA (2 bytes). This creates the same kind of "leak" (technically blowing an internal stack). Neither one is leaking "memory" in the OP's sense, and neither one is "unrecoverable" in OP's sense either (since the While "leak" can be reclaimed by hitting an End, and the infinite recursion can be stopped by... making it not-infinite) — but I don't think the OP's definitions make a whole lot of sense in non-C languages anyway. :) \$\endgroup\$ Commented Feb 20, 2017 at 8:45
36
\$\begingroup\$

Python <3.6.5, 23 bytes

property([]).__init__()

property.__init__ leaks references to the property's old fget, fset, fdel, and __doc__ if you call it on an already-initialized property instance. This is a bug, eventually reported as part of CPython issue 31787 and fixed in Python 3.6.5 and Python 3.7.0. (Also, yes, property([]) is a thing you can do.)

\$\endgroup\$
2
  • \$\begingroup\$ Has a bug report been sent? \$\endgroup\$
    – mbomb007
    Commented Aug 3, 2018 at 14:39
  • 1
    \$\begingroup\$ @mbomb007: CPython issue 31787. \$\endgroup\$ Commented Aug 3, 2018 at 16:43
31
\$\begingroup\$

C#, 34 bytes

class L{~L(){for(;;)new L();}}

This solution does not require the Heap. It just needs a real hard working GC (Garbage Collector).

Essentially it turns the GC into its own enemy.

Explanation

Whenever the destructor is called, It creates new instances of this evil class as long as the timeout runs out and tells the GC to just ditch that object without waiting for the destructor to finish. By then thousands of new instances have been created.

The "evilness" of this is, the harder the GC is working, the more this will blow up in your face.

Disclaimer: Your GC may be smarter than mine. Other circumstances in the program may cause the GC to ignore the first object or its destructor. In these cases this will not blow up. But in many variations it will. Adding a few bytes here and there might ensure a leak for every possible circumstances. Well except for the power switch maybe.

Test

Here is a test suite:

using System;
using System.Threading;
using System.Diagnostics;
class LeakTest {
    public static void Main() {
        SpawnLeakage();
        Console.WriteLine("{0}-: Objects may be freed now", DateTime.Now);
        // any managed object created in SpawbLeakage 
        //  is no longer accessible
        // The GC should take care of them
        
        // Now let's see
        MonitorGC();
    }
    public static void SpawnLeakage() {
        Console.WriteLine("{0}-: Creating 'leakage' object", DateTime.Now);
        L l = new L();
    }
    public static void MonitorGC() {
        while(true) {
            int top = Console.CursorTop;
            int left = Console.CursorLeft;
            Console.WriteLine(
                "{0}-: Total managed memory: {1} bytes",
                DateTime.Now,
                GC.GetTotalMemory(false)
            );
            Console.SetCursorPosition(left, top);
        }
    }
}

Output after 10 minutes:

2/19/2017 2:12:18 PM-: Creating 'leakage' object
2/19/2017 2:12:18 PM-: Objects may be freed now
2/19/2017 2:22:36 PM-: Total managed memory: 2684476624 bytes

That's 2 684 476 624 bytes. The Total WorkingSet of the process was about 4.8 GB

This answer has been inspired by Eric Lippert's wonderful article: When everything you know is wrong.

\$\endgroup\$
9
  • \$\begingroup\$ This is fascinating. Does the garbage collector "Forget" that some things exist and lose track of them because of this? I dont know much about c#. Also now I am wondering, what is the difference between a bomb and a leak? I imagine a similar fiasco could be created by calling a constructor from inside of a constructor, or having an infinite recursing function that never stops, although technically the system never loses track of those references, it just runs out of space... \$\endgroup\$
    – don bright
    Commented Feb 20, 2017 at 0:50
  • 1
    \$\begingroup\$ A constructor within a constructor would cause a stack overflow. But the destructor of an instance gets called in a flat hierarchy. The GC actually never loses track of the objects. Just whenever it tries to destroy them it unwittingly create new objects. User code on the other hand has no access to said objects. Also the mentioned inconsistencies may arise since the GC may decide to destroy an object without calling its destructor. \$\endgroup\$
    – MrPaulch
    Commented Feb 20, 2017 at 7:01
  • \$\begingroup\$ Wouldn't the challenge be complete by just using class L{~L(){new L();}}? AFAIK the for(;;) only makes it leak memory faster, right? \$\endgroup\$
    – BgrWorker
    Commented Feb 20, 2017 at 8:05
  • 1
    \$\begingroup\$ Sadly, no. Since for each destroyed object only one new instance is going to be created, which then again is inaccessible and marked for destruction. Repeat. Only ever one object will be pending for destruction. No increasing population. \$\endgroup\$
    – MrPaulch
    Commented Feb 20, 2017 at 8:09
  • 2
    \$\begingroup\$ Not really. Eventually one finalized will be ignored. The corresponding object will be eaten regardless. \$\endgroup\$
    – MrPaulch
    Commented Feb 20, 2017 at 8:24
29
\$\begingroup\$

Javascript, 14 bytes

Golfed

setInterval(0)

Registers an empty interval handler with a default delay, discarding the resulting timer id (making it impossible to cancel).

enter image description here

I've used a non-default interval, to create several million timers, to illustrate the leak, as using a default interval eats CPU like mad.

\$\endgroup\$
10
  • 6
    \$\begingroup\$ Haha I love that you've typed 'Golfed', makes me curious about the ungolfed version \$\endgroup\$
    – Martijn
    Commented Feb 20, 2017 at 15:18
  • 9
    \$\begingroup\$ it might look like this if(window && window.setInterval && typeof window.setInterval === 'function') { window.setInterval(0); } \$\endgroup\$ Commented Feb 20, 2017 at 15:51
  • 4
    \$\begingroup\$ Actually, this is not impossible to cancel: interval (and timeout) ID's are numbered sequentially, so it's fairly easy to cancel the thing just by calling clearInterval with an incrementing ID until your interval is gone. For example: for(let i=0;i<1e5;i++){try{clearInterval(i);}catch(ex){}} \$\endgroup\$ Commented Feb 20, 2017 at 22:40
  • 5
    \$\begingroup\$ @user2428118 As zeppelin says, this is no more "legitmate" than saying the C/C++ leaks aren't "real" because you could brute force calls to free() \$\endgroup\$
    – TripeHound
    Commented Feb 21, 2017 at 12:03
  • 1
    \$\begingroup\$ Wow, not many challenges where JavaScript is an actual contender... \$\endgroup\$ Commented Feb 21, 2017 at 18:49
26
\$\begingroup\$

C (gcc), 15 bytes

f(){malloc(1);}

Verification

$ cat leak.c
f(){malloc(1);}
main(){f();}
$ gcc -g -o leak leak.c
leak.c: In function ‘f’:
leak.c:1:5: warning: incompatible implicit declaration of built-in function ‘malloc’ [enabled by default]
 f(){malloc(1);}
     ^
$ valgrind --leak-check=full ./leak
==32091== Memcheck, a memory error detector
==32091== Copyright (C) 2002-2013, and GNU GPL'd, by Julian Seward et al.
==32091== Using Valgrind-3.10.0 and LibVEX; rerun with -h for copyright info
==32091== Command: ./leak
==32091==
==32091==
==32091== HEAP SUMMARY:
==32091==     in use at exit: 1 bytes in 1 blocks
==32091==   total heap usage: 1 allocs, 0 frees, 1 bytes allocated
==32091==
==32091== 1 bytes in 1 blocks are definitely lost in loss record 1 of 1
==32091==    at 0x4C29110: malloc (in /usr/lib64/valgrind/vgpreload_memcheck-amd64-linux.so)
==32091==    by 0x40056A: f (leak.c:1)
==32091==    by 0x40057A: main (leak.c:2)
==32091==
==32091== LEAK SUMMARY:
==32091==    definitely lost: 1 bytes in 1 blocks
==32091==    indirectly lost: 0 bytes in 0 blocks
==32091==      possibly lost: 0 bytes in 0 blocks
==32091==    still reachable: 0 bytes in 0 blocks
==32091==         suppressed: 0 bytes in 0 blocks
==32091==
==32091== For counts of detected and suppressed errors, rerun with: -v
==32091== ERROR SUMMARY: 1 errors from 1 contexts (suppressed: 0 from 0)
\$\endgroup\$
19
\$\begingroup\$

Rust, 52 bytes

extern{fn malloc(_:u8);}fn main(){unsafe{malloc(9)}}

Allocates some bytes with the system malloc. This assumes the wrong ABI is acceptable.


Rust (in theory), 38 bytes

fn main(){Box::into_raw(Box::new(1));}

We allocate memory on the heap, extract a raw pointer, and then just ignore it, effectively leaking it. (Box::into_raw is shorter then std::mem::forget).

However, Rust by default uses jemalloc, which valgrind can't detect any leakage. We could switch to the system allocator but that adds 50 bytes and requires nightly. Thanks so much for memory safety.


Output of the first program:

==10228== Memcheck, a memory error detector
==10228== Copyright (C) 2002-2015, and GNU GPL'd, by Julian Seward et al.
==10228== Using Valgrind-3.12.0.SVN and LibVEX; rerun with -h for copyright info
==10228== Command: ./1
==10228== 
==10228== 
==10228== HEAP SUMMARY:
==10228==     in use at exit: 9 bytes in 1 blocks
==10228==   total heap usage: 7 allocs, 6 frees, 2,009 bytes allocated
==10228== 
==10228== LEAK SUMMARY:
==10228==    definitely lost: 9 bytes in 1 blocks
==10228==    indirectly lost: 0 bytes in 0 blocks
==10228==      possibly lost: 0 bytes in 0 blocks
==10228==    still reachable: 0 bytes in 0 blocks
==10228==         suppressed: 0 bytes in 0 blocks
==10228== Rerun with --leak-check=full to see details of leaked memory
==10228== 
==10228== For counts of detected and suppressed errors, rerun with: -v
==10228== ERROR SUMMARY: 0 errors from 0 contexts (suppressed: 0 from 0)
\$\endgroup\$
3
  • \$\begingroup\$ awesome. posts like this led me to explore Rust over the past year, definitely one of the most fun languages i have tried to learn. \$\endgroup\$
    – don bright
    Commented Mar 4, 2019 at 1:54
  • \$\begingroup\$ I am not aware of any operating systems that have a usize defined as u8. It should be fn malloc(_:usize);. \$\endgroup\$ Commented Jun 11, 2020 at 1:45
  • \$\begingroup\$ @Sapphire_Brick using the correct function prototype would waste 3 bytes. thus the comment "This assumes the wrong ABI is acceptable". \$\endgroup\$
    – kennytm
    Commented Jun 12, 2020 at 15:55
19
\$\begingroup\$

Java, 10 bytes

Finally, a competitive answer in Java !

Golfed

". "::trim

This is a method reference (against a string constant), which can be used like that:

Supplier<String> r = ". "::trim

A literal string ". " will be automatically added to the global interned strings pool, as maintained by the java.lang.String class, and as we immediatelly trim it, the reference to it can not be reused further in the code (unless you declare exactly the same string again).

...

A pool of strings, initially empty, is maintained privately by the class String.

All literal strings and string-valued constant expressions are interned. String literals are defined in section 3.10.5 of the The Java™ Language Specification.

...

https://docs.oracle.com/javase/8/docs/api/java/lang/String.html#intern--

You can turn this in a "production grade" memory leak, by adding the string to itself and then invoking the intern() method explicitly, in a loop.

\$\endgroup\$
21
  • 2
    \$\begingroup\$ I considered this for C#... but I don't think it counts, because as you say you can access that memory by including another string literal. I'd also be interested to know what ("." + " ").intern() would do (if they were user input or w/e, so we discount compiler optimisations). \$\endgroup\$ Commented Feb 19, 2017 at 9:02
  • 1
    \$\begingroup\$ Indeed, the only consensus is slim at best, I'm just firmly on the "the code should compile" side. I'm still not sure I buy this solution given the wording on the question (these strings can't be freed, and they can be found in normal operating code even though it's unlikely), but I invite others to make their own judgement \$\endgroup\$ Commented Feb 19, 2017 at 18:32
  • 3
    \$\begingroup\$ That string isn't even inaccessible, let alone leaked. We can retrieve it at any time by interning an equal string. If this were to count, any unused global variable (private static in Java) would be a leak. That's not how memory leaks are defined. \$\endgroup\$ Commented Feb 20, 2017 at 1:00
  • 3
    \$\begingroup\$ @user2357112 "...That string isn't even inaccessible..." That only looks obvious because you see the code. Now consider you got this method reference X() as an argument to your code, you know that it allocates (and interns) a string literal inside, but you do not know which one exactly, it might be ". " or "123" or any other string of a (generally) unknown length. Would you please demonstrate how you can still access it, or deallocate the entry in the "intern" pool it occupies? \$\endgroup\$
    – zeppelin
    Commented Feb 20, 2017 at 9:40
  • 2
    \$\begingroup\$ @user2357112 On a machine with a finite memory, you can access a value stored in any piece of memory simply by guessing it correctly, but that does not mean that such a thing as memory leaks do not exist. there's probably some way to use reflection to determine the string's contents too could you demonstrate this ? (hint, String.intern() is implemented in the native code). \$\endgroup\$
    – zeppelin
    Commented Feb 20, 2017 at 15:44
18
\$\begingroup\$

8086 ASM, 3 bytes

This examples assumes that a C runtime is linked in.

jmp _malloc

this assembles to e9 XX XX where XX XX is the relative address of _malloc

This invokes malloc to allocate an unpredictable amount of memory and then immediately returns, terminating the processes. On some operating systems like DOS, the memory might not be reclaimable at all until the system is rebooted!

\$\endgroup\$
2
  • \$\begingroup\$ The normal implementation of malloc will result in memory being freed on process exit. \$\endgroup\$
    – Joshua
    Commented Nov 17, 2017 at 0:00
  • \$\begingroup\$ @Joshua Yeah, but that's implementation defined behaviour. \$\endgroup\$
    – FUZxxl
    Commented Nov 17, 2017 at 0:03
12
\$\begingroup\$

Forth, 6 bytes

Golfed

s" " *

Allocates an empty string with s" ", leaving it's address and length (0) on the stack, then multiplies them (resulting in a memory address being lost).

Valgrind

%valgrind --leak-check=full gforth -e 's" " * bye'
...
==12788== HEAP SUMMARY:
==12788==     in use at exit: 223,855 bytes in 3,129 blocks
==12788==   total heap usage: 7,289 allocs, 4,160 frees, 552,500 bytes allocated
==12788== 
==12788== 1 bytes in 1 blocks are definitely lost in loss record 1 of 22
==12788==    at 0x4C2AB80: malloc (in /usr/lib/valgrind/vgpreload_memcheck-amd64-linux.so)
==12788==    by 0x406E39: gforth_engine (in /usr/bin/gforth-0.7.0)
==12788==    by 0x41156A: gforth_go (in /usr/bin/gforth-0.7.0)
==12788==    by 0x403F9A: main (in /usr/bin/gforth-0.7.0)
==12788== 
...
==12818== LEAK SUMMARY:
==12818==    definitely lost: 1 bytes in 1 blocks
==12818==    indirectly lost: 0 bytes in 0 blocks
\$\endgroup\$
10
\$\begingroup\$

Befunge (fungi), 1 byte

$

This may be platform dependent and version dependent (I've only tested with version 1.0.4 on Windows), but fungi has historically been a very leaky interpreter. The $ (drop) command shouldn't do anything on an empty stack, but looping over this code somehow manages to leak a lot of memory very quickly. Within a matter of seconds it will have used up a couple of gigs and will crash with an "out of memory" error.

Note that it doesn't necessarily have to be a $ command - just about anything would do. It won't work with a blank source file though. There's got to be at least one operation.

\$\endgroup\$
10
\$\begingroup\$

go 45 bytes

package main
func main(){go func(){for{}}()}

this creates an anonymous goroutine with an infinite loop inside of it. the program can continue to run as normal, as starting the goroutine is kind of like spawning a concurrently running small thread, but the program has no way to reclaim the memory that was allocated for the goroutine. the garbage collector will never collect it either since it is still running. some people call this 'leaking a goroutine'

\$\endgroup\$
2
  • 1
    \$\begingroup\$ golf check: this is 2 bytes shorter than calling C.malloc(8), since you need to import"C" \$\endgroup\$
    – Riking
    Commented Mar 1, 2017 at 0:44
  • 1
    \$\begingroup\$ There are three kinds of answers. The low-level languages where you just malloc then discard it, the garbage collected languages where you create an infinite loop that doesn't give the garbage collector time to deallocate memory, and the garbage collected languages that leak memory due to a bug in the interpreter. \$\endgroup\$ Commented Jun 11, 2020 at 1:49
9
\$\begingroup\$

Java 1.3, 23 bytes

void l(){new Thread();}

Creating a thread but not starting it. The thread is registered in the internal thread pool, but will never be started, so never ended and therefore never be a candidate for the GC. It is an unretrievable object, stuck in Java limbos.

It's a bug in Java until 1.3 included as it was fixed afterwards.

Testing

The following program makes sure to pollute the memory with new thread objects and show a decreasing free memory space. For the sake of leaks testing, I intensively makes the GC run.

public class Pcg110485 {

    static
    void l(){new Thread();}

    public static void main(String[] args) {

        while(true){
            l();
            System.gc();
            System.out.println(Runtime.getRuntime().freeMemory());
        }
    }
}
\$\endgroup\$
3
  • \$\begingroup\$ Since this works only on specific Java versions, you should say "Java 3" in your header instead. \$\endgroup\$
    – user18932
    Commented Feb 20, 2017 at 15:43
  • 5
    \$\begingroup\$ There's no such thing as Java 3. It's Java 1.3. There was Java 1.0, 1.1, 2, 1.3, 1.4, 5, 6, 7, 8, 9. Weird numbering, but that's how it is. \$\endgroup\$ Commented Feb 21, 2017 at 1:54
  • \$\begingroup\$ This was my idea too. Damn. \$\endgroup\$ Commented Jun 28, 2017 at 19:12
8
\$\begingroup\$

Swift 3, 38 bytes

New version:

class X{var x: X!};do{let x=X();x.x=x}

x has a strong reference to itself, so it will not be deallocated, leading to a memory leak.

Old version:

class X{var y:Y!}
class Y{var x:X!}
do{let x=X();let y=Y();x.y=y;y.x=x}

x contains a strong reference to y, and vice versa. Thus, neither will be deallocated, leading to a memory leak.

\$\endgroup\$
8
  • \$\begingroup\$ Hmm, you still can reference that memory through x and y, so this does not really look like a leak to me (unless you destroy them somehow). \$\endgroup\$
    – zeppelin
    Commented Feb 19, 2017 at 6:19
  • \$\begingroup\$ @zeppelin The last line could be wrapped in a function to fix that \$\endgroup\$
    – NobodyNada
    Commented Feb 19, 2017 at 18:51
  • \$\begingroup\$ @NobodyNada, if I were to put the last line in a do block that would fix the problem zeppelin raised right? \$\endgroup\$
    – Daniel
    Commented Feb 19, 2017 at 19:04
  • \$\begingroup\$ @Dopapp Yeah; a do would work as well. Good idea! \$\endgroup\$
    – NobodyNada
    Commented Feb 19, 2017 at 19:17
  • \$\begingroup\$ It can be shortened, you don't need two classes - X can hold reference to itself: class X{var x: X!};do{let x=X();x.x=x} \$\endgroup\$ Commented Feb 20, 2017 at 18:59
7
\$\begingroup\$

Delphi (Object Pascal) - 33 bytes

Creating an object without a variable, full console program:

program;begin TObject.Create;end.

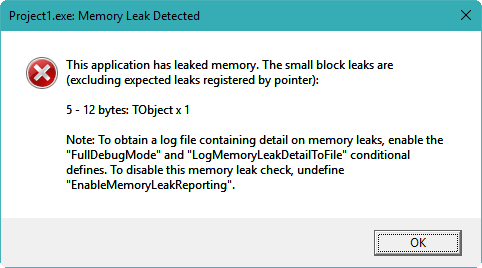
Enabling FastMM4 in the project will show the memory leak:

enter image description here

\$\endgroup\$
6
\$\begingroup\$

C# - 84bytes

class P{static void Main(){System.Runtime.InteropServices.Marshal.AllocHGlobal(1);}}

This allocates exactly 1 byte of unmanaged memory, and then loses the IntPtr, which I believe is the only way to get at or free it. You can test it by stuffing it in a loop, and waiting for the application to crash (might want to add a few zeros to speed things up).

I considered System.IO.File.Create("a"); and such, but I'm not convinced that these are necessarily memory leaks, as the application itself will collect the memory, it's the OS underneath that might leak (because Close or Dispose were not called). File access stuff also requires file system permissions, and no one wants to rely on those. And it turns out this won't leak anyway, because there is nothing stopping the finaliser being called (which does free the underlying resources is possible), which the framework includes to mitigate these sorts of error of judgement (to some degree), and to confuse programmers with seemingly non-deterministic file locking (if you're a cynic). Thanks to Jon Hanna for putting me straight on this.

I am a tad disappointed that I can't find a shorter way. The .NET GC works, I can't think of any IDisposables in mscorlib that will definitely leak (and indeed they all seem to have finalisers, how annoying), I'm not aware of any other way to allocate unmanaged memory (short of PInvoke), and reflection ensures anything with a reference to it (regardless of language semantics (e.g. private members or classes with no accessors)) can be found.

\$\endgroup\$
7
  • 2
    \$\begingroup\$ System.IO.File.Create("a") won't leak anything, but GC.SuppressFinalize(System.IO.File.Create("a")) will as it is explicitly asked not to run the finaliser of the FileStream produced. \$\endgroup\$
    – Jon Hanna
    Commented Feb 19, 2017 at 3:13
  • \$\begingroup\$ @JonHanna quite right. My IDisposable paranoia seems to have got the better of me. \$\endgroup\$ Commented Feb 19, 2017 at 8:40
  • \$\begingroup\$ You might have a chance to make GDI+ leak using System.Drawing.Bitmap. Don't know if it counts because it's a windows library causing the leak, not the program itself. \$\endgroup\$
    – BgrWorker
    Commented Feb 20, 2017 at 7:42
  • \$\begingroup\$ @BgrWorker they no doubt have a finaliser also, and I tend to avoid external libraries in code-golf because I don't agree with the consensus on costing them: if you can find a way you're confident in, feel free to post it in your own answer! \$\endgroup\$ Commented Feb 20, 2017 at 17:45
  • \$\begingroup\$ <!-- language: lang-c# --> Thanks for this & nice answer! (It's C# so I love it) \$\endgroup\$
    – Metoniem
    Commented Feb 22, 2017 at 13:50
5
\$\begingroup\$

Factor, 13 bytes

Factor has automatic memory management, but also gives access to some libc functionality:

1 malloc drop

Manually allocates 1 byte of memory, returns it's address, and drops it.

malloc actually registers a copy to keep track of memory leaks adn double frees, but identifying the one you leaked is not an easy task.

If you prefer to make sure you really lose that reference:

1 (malloc) drop

Testing leaks with [ 1 malloc drop ] leaks. says:

| Disposable class | Instances |                    |
| malloc-ptr       | 1         | [ List instances ] |

Testing leaks with [ 1 (malloc) drop ] leaks. says:

| Disposable class | Instances | |

Oh no! Poor factor, it's got Alzheimer now! D:

\$\endgroup\$
4
\$\begingroup\$

AutoIt, 39 bytes

#include<Memory.au3>
_MemGlobalAlloc(1)

Allocates one byte from the heap. Since the handle returned by _MemGlobalAlloc is discarded, there is no way to explicitly free that allocation.

\$\endgroup\$
4
\$\begingroup\$

Common Lisp (SBCL only), 28 26 bytes

sb-alien::(make-alien int)

You run it like so: sbcl --eval 'sb-alien::(make-alien int)'; nothing is printed nor returned, but the memory allocation happens. If I wrap the form inside a (print ...), the pointer is displayed in the REPL.

  1. package::(form) is a special notation in SBCL for temporarily binding the current package while reading a form. This is used here to avoid prefixing both make-alien and int with sb-alien. I think it would be cheating to assume the current package is set to this one, because that's not the case at startup.

  2. make-alien allocates memory for a given type and an optional size (using malloc).

  3. When executing this in the REPL, add 0 after the allocation so that the REPL does not return the pointer, but that value instead. Otherwise, that would no be a real leak because the REPL remembers the last three returned values (See *, **, ***) and we could still have a chance to free the allocated memory.

2 bytes removed thanks to PrzemysławP, thanks!

\$\endgroup\$
2
  • 1
    \$\begingroup\$ Can't you use 1 (or 2, 3, etc.) instead of () so that you return value 1? It would save 1 byte. Also is this answer REPL only? Maybe if you load code with load you can not include () or anything at the end, because it will not be accessible anyway? \$\endgroup\$
    – user65167
    Commented Nov 29, 2017 at 23:20
  • 1
    \$\begingroup\$ @PrzemysławP You are right on both points, I tried with eval and this works as you said. Thanks a lot! \$\endgroup\$
    – coredump
    Commented Nov 30, 2017 at 8:42
3
\$\begingroup\$

C++, 16 bytes

main(){new int;}

I don't have valgrind to check it leaks, but pretty sure it should. Otherwise I would try:

main(){[]{new int;}();}

Valgrind result

(It does leak indeed)

==708== LEAK SUMMARY:
==708==    definitely lost: 4 bytes in 1 blocks
\$\endgroup\$
3
  • \$\begingroup\$ @WheatWizard I am using g++ 4.3.2 (not the most recent one) and it compiles just fine. No return type is int by default I think. With -Wall I have a warning though: plop.cpp:1: warning: ISO C++ forbids declaration of 'main' with no type \$\endgroup\$
    – matovitch
    Commented Feb 20, 2017 at 15:54
  • 2
    \$\begingroup\$ @WheatWizard Sorry, I just saw you gave the c++ example to start the contest. Coming from reddit I only looked at the answers and (strangely) did not saw any C++. I feel a bit dumb. :/ \$\endgroup\$
    – matovitch
    Commented Feb 20, 2017 at 16:19
  • \$\begingroup\$ Consensus is that you can count just []{new int;} as a C++ function (the challenge didn't specify a whole program). \$\endgroup\$ Commented Aug 3, 2018 at 11:39
3
\$\begingroup\$

Java (OpenJDK 9), 322 220 bytes

import sun.misc.*;class Main{static void main(String[]a)throws Exception{java.lang.reflect.Field f=Unsafe.class.getDeclaredField("theUnsafe");f.setAccessible‌​(1<2);((Unsafe)f.get‌​(1)).allocateMemory(‌​1);}}

Try it online!

This is a other Memory leak that don't use the String Cache. It Allocates half of your RAM and you can't do anything with it.

Thanks to zeppelin for saving all the bytes

\$\endgroup\$
5
  • \$\begingroup\$ You can save a bunch of bytes by obtaining the Unsafe instance from the static variable inside it, like that: import sun.misc.*;class M{static void main(String[]a)throws Exception{java.lang.reflect.Field f=Unsafe.class.getDeclaredField("theUnsafe");f.setAccessible(1<2);((Unsafe)f.get(1)).allocateMemory(1);}} \$\endgroup\$
    – zeppelin
    Commented Feb 20, 2017 at 10:23
  • \$\begingroup\$ And you can save some more by replacing the public static void main by a static initializer static{try{}catch(Exception e){}} (which could be a bit more tricky to launch but is nevertheless valid and compilable). \$\endgroup\$
    – zeppelin
    Commented Feb 20, 2017 at 10:25
  • \$\begingroup\$ yhea the use of the constructor was used in a Android version of code I used. I will change some things when im @home but I will go the path you went with a single statement ;) \$\endgroup\$
    – Serverfrog
    Commented Feb 20, 2017 at 17:42
  • \$\begingroup\$ Remove whitespace, use a instead of args, and remove public. tio.run/nexus/… \$\endgroup\$
    – Pavel
    Commented Feb 21, 2017 at 8:02
  • \$\begingroup\$ true can be replaced with 1>0 \$\endgroup\$
    – masterX244
    Commented Feb 23, 2017 at 14:51
3
\$\begingroup\$

C#, 109 bytes

public class P{static void Main({for(;;)System.Xml.Serialization.XmlSerializer.FromTypes(new[]{typeof(P)});}}

We found the idea behind this leak in production code and researching it leads to this article. The main problem is in this long quote from the article (read it for more info):

Searching my code for PurchaseOrder, I find this line of code in page_load of one of my pages XmlSerializer serializer = new XmlSerializer(typeof(PurchaseOrder), new XmlRootAttribute(“”));

This would seem like a pretty innocent piece of code. We create an XMLSerializer for PurchaseOrder. But what happens under the covers?

If we take a look at the XmlSerializer constructor with Reflector we find that it calls this.tempAssembly = XmlSerializer.GenerateTempAssembly(this.mapping, type, defaultNamespace, location, evidence); which generates a temp (dynamic) assembly. So every time this code runs (i.e. every time the page is hit) it will generate a new assembly.

The reason it generates an assembly is that it needs to generate functions for serializing and deserializing and these need to reside somewhere.

Ok, fine… it creates an assembly, so what? When we’re done with it, it should just disappear right?

Well… an assembly is not an object on the GC Heap, the GC is really unaware of assemblies, so it won’t get garbage collected. The only way to get rid of assemblies in 1.0 and 1.1 is to unload the app domain in which it resides.

And therein lies the problem Dr Watson.

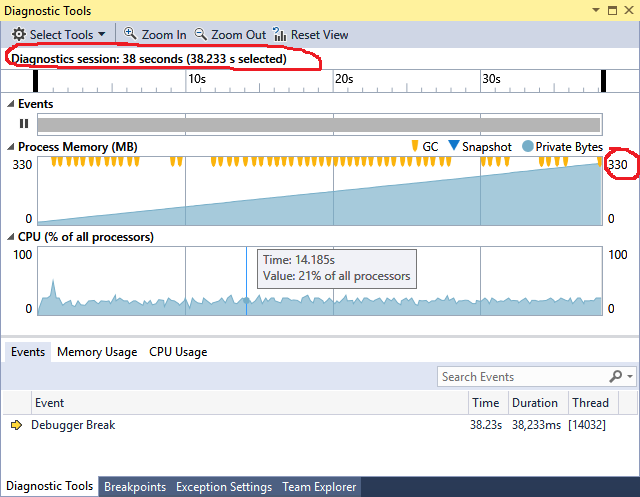
Running from the compiler in Visual Studio 2015 and using the Diagnostic Tools Window shows the following results after about 38 seconds. Note the Process memory is steadily climbing and the Garbage Collector (GC) keeps running but can't collect anything.

Diagnostic Tools Window

\$\endgroup\$
2
\$\begingroup\$

C 30 bytes

f(){int *i=malloc(sizeof(4));}

Valgrind Results:

         ==26311== HEAP SUMMARY:
         ==26311==     in use at exit: 4 bytes in 1 blocks
         ==26311==   total heap usage: 1 allocs, 0 frees, 4 bytes allocated
         ==26311== 
         ==26311== LEAK SUMMARY:
         ==26311==    definitely lost: 4 bytes in 1 blocks
         ==26311==    indirectly lost: 0 bytes in 0 blocks
         ==26311==      possibly lost: 0 bytes in 0 blocks
         ==26311==    still reachable: 0 bytes in 0 blocks
         ==26311==         suppressed: 0 bytes in 0 blocks
         ==26311== Rerun with --leak-check=full to see details of leaked memory
\$\endgroup\$
2
  • 2
    \$\begingroup\$ Is it possible to instead just do main(){malloc(1);}? \$\endgroup\$ Commented Feb 20, 2017 at 18:46
  • \$\begingroup\$ @Yea it is! But its already been posted! \$\endgroup\$
    – Abel Tom
    Commented Feb 20, 2017 at 18:52
2
\$\begingroup\$

Dart, 76 bytes

import'dart:async';main()=>new Stream.periodic(Duration.ZERO).listen((_){});

A bit like the JavaScript answer. When you call .listen on a Dart stream object you are given back a StreamSubscription, which allows you to disconnect from the stream. However, if you throw that away, you can never unsubscribe from the stream, causing a leak. The only way the leak can be fixed is if the Stream itself gets collected, but its still referenced internally by a StreamController+Timer combo.

Unfortunately, Dart is too smart for the other stuff I've tried. ()async=>await new Completer().future doesn't work because using await is the same as doing new Completer().future.then(<continuation>), which allows the closure itself to be destroyed the second Completer isn't referenced (Completer holds a reference to the Future from .future, Future holds a reference to the continuation as a closure).

Also, Isolates (aka threads) are cleaned up by GC, so spawning yourself in a new thread and immediately pausing it (import'dart:isolate';main(_)=>Isolate.spawn(main,0,paused:true);) doesn't work. Even spawning an Isolate with an infinite loop (import'dart:isolate';f(_){while(true){print('x');}}main()=>Isolate.spawn(f,0);) kills the Isolate and exits the program.

Oh well.

\$\endgroup\$
1
  • \$\begingroup\$ if your main program kept running and doing other stuff, would the garbage collector ever be able to stop the isolate? i ask because my goroutine example sounds similar... i assumed that the fact that the program exits and gives all memory back to the OS doesn't necessarily mean it hasn't leaked. \$\endgroup\$
    – don bright
    Commented Feb 21, 2017 at 5:06
2
\$\begingroup\$

Swift, 12 bytes

[3,5][0...0]

Explanation:

This is a de-facto memory leak that can occur in any language, regardless if the language uses memory manual management, automated reference counting (ARC, like Swift), or even sweeping garbage collection.

[3,5] is just an array literal. This array allocates enough memory for at least these those 2 elements. The 3 and 5 are just arbitrary.

Subscripting (indexing) an Array<T> produces an ArraySlice<T>. An ArraySlice<T> is a view into the memory of the Array it was created from.

[3,5][0...0] produces an ArraySlice<Int>, whose value is [3]. Note that the 3 in this slice is the same 3 element as the 3 in the original Array shown above, not a copy.

The resulting slice can then be stored into a variable and used. The original array is no longer referenced, so you would think it could be deallocated. However, it cannot.

Since the slice exposes a view onto the memory of the array it came from, the original array must be kept alive as long as the slice lives. So of the original 2 element-sizes worth of memory that were allocated, only first element-size worth of memory is being used, with the other the one being required to exist so as to not allocate the first. The second element-size of memory is de-factor leaked.

The solution to this problem is to not keep alive small slices of large arrays for long. If you need to persist the slice contents, then promote it to an Array, which will trigger the memory to be copied, thus removing the dependancy on the original array's memory:

Array([3,5][0...0])
\$\endgroup\$
4
  • \$\begingroup\$ Whaaaaaaaaaaat? \$\endgroup\$ Commented Jul 1, 2020 at 18:44
  • \$\begingroup\$ @Sapphire_Brick Hmm? \$\endgroup\$
    – Alexander
    Commented Jul 1, 2020 at 23:54
  • \$\begingroup\$ @AlexanderReinstateMonica I'm just shocked that such a simple code causes a memory leak. \$\endgroup\$ Commented Jul 2, 2020 at 19:39
  • \$\begingroup\$ @Sapphire_Brick Yep, I haven't seen any automated memory management systems that can clear up something like this. The book keeping required to know that you're only using a small portion of a large allocated object is probably not worth the performance cost it introduces \$\endgroup\$
    – Alexander
    Commented Jul 2, 2020 at 19:50
2
\$\begingroup\$

Solution 1: C (Mac OS X x86_64), 109 bytes

The source for golf_sol1.c

main[]={142510920,2336753547,3505849471,284148040,2370322315,2314740852,1351437506,1208291319,914962059,195};

The above program needs to be compiled with execution access on the __DATA segment.

clang golf_sol1.c -o golf_sol1 -Xlinker -segprot -Xlinker __DATA -Xlinker rwx -Xlinker rwx

Then to execute the program run the following:

./golf_sol1 $(ruby -e 'puts "\xf5\xff\xff\xfe\xff\xff\x44\x82\x57\x7d\xff\x7f"')

Results:

Unfortunately Valgrind does not watch for memory allocated from system calls, so I can't show a nice detected leak.

However we can look at vmmap to see the large chunk of allocated memory (MALLOC metadata).

                                VIRTUAL   REGION 
REGION TYPE                        SIZE    COUNT (non-coalesced) 
===========                     =======  ======= 
Kernel Alloc Once                    4K        2 
MALLOC guard page                   16K        4 
MALLOC metadata                   16.2M        7 
MALLOC_SMALL                      8192K        2         see MALLOC ZONE table below
MALLOC_TINY                       1024K        2         see MALLOC ZONE table below
STACK GUARD                       56.0M        2 
Stack                             8192K        3 
VM_ALLOCATE (reserved)             520K        3         reserved VM address space (unallocated)
__DATA                             684K       42 
__LINKEDIT                        70.8M        4 
__TEXT                            5960K       44 
shared memory                        8K        3 
===========                     =======  ======= 
TOTAL                            167.0M      106 
TOTAL, minus reserved VM space   166.5M      106 

Explanation

So I think I need to describe what's actually going on here, before moving onto the improved solution.

This main function is abusing C's missing type declaration (so it defaults to int without us needing to waste characters writing it), as well how symbols work. The linker only cares about whether of not it can find a symbol called main to call to. So here we're making main an array of int's which we're initializing with our shellcode that will be executed. Because of this, main will not be added to the __TEXT segment but rather the __DATA segment, reason we need to compile the program with an executable __DATA segment.

The shellcode found in main is the following:

movq 8(%rsi), %rdi
movl (%rdi), %eax
movq 4(%rdi), %rdi
notl %eax
shrq $16, %rdi
movl (%rdi), %edi
leaq -0x8(%rsp), %rsi
movl %eax, %edx
leaq -9(%rax), %r10
syscall
movq (%rsi), %rsi
movl %esi, (%rsi)
ret

What this is doing is calling the syscall function to allocate a page of memory (the syscall mach_vm_allocate uses internally). RAX should equal 0x100000a (tells the syscall which function we want), while RDI holds the target for the allocation (in our case we want this to be mach_task_self()), RSI should hold the address to write the pointer to the newly created memory (so we are just pointing it to a section on the stack), RDX holds the size of the allocation (we're just passing in RAX or 0x100000a just to save on bytes), R10 holds the flags (we're indicating it can be allocated anywhere).

Now it's not plainly obvious where RAX and RDI are getting their values from. We know RAX needs to be 0x100000a, and RDI needs to be the value mach_task_self() returns. Luckily mach_task_self() is actually a macro for a variable (mach_task_self_), which is at the same memory address every time (should change on reboot however). In my particular instance mach_task_self_ happens to be located at 0x00007fff7d578244. So to cut down on instructions, we'll instead be passing in this data from argv. This is why we run the program with this expression $(ruby -e 'puts "\xf5\xff\xff\xfe\xff\xff\x44\x82\x57\x7d\xff\x7f"') for the first argument. The string is the two values combined, where the RAX value (0x100000a) is only 32 bits and has had a one's complement applied to it (so there's no null bytes; we just NOT the value to get the original), the next value is the RDI (0x00007fff7d578244) which has been shifted to the left with 2 extra junk bytes added to the end (again to exclude the null bytes, we just shift it back to the right to get it back to the original).

After the syscall we're writing to our newly allocated memory. The reason for this is because memory allocated using mach_vm_allocate (or this syscall) are actually VM pages, and are not automatically paged into memory. Rather they are reserved until data is written to them, and then those pages are mapped into memory. Wasn't sure if it would meet the requirements if it was only reserved.

For the next solution we'll be taking advantage of the fact that our shellcode has no null bytes, and so can move it outside of our program's code to reduce the size.

Solution 2: C (Mac OS X x86_64), 44 bytes

The source for golf_sol2.c

main[]={141986632,10937,1032669184,2,42227};

The above program needs to be compiled with execution access on the __DATA segment.

clang golf_sol2.c -o golf_sol2 -Xlinker -segprot -Xlinker __DATA -Xlinker rwx -Xlinker rwx

Then to execute the program run the following:

./golf_sol2 $(ruby -e 'puts "\xb8\xf5\xff\xff\xfe\xf7\xd0\x48\xbf\xff\xff\x44\x82\x57\x7d\xff\x7f\x48\xc1\xef\x10\x8b\x3f\x48\x8d\x74\x24\xf8\x89\xc2\x4c\x8d\x50\xf7\x0f\x05\x48\x8b\x36\x89\x36\xc3"')

The result should be the same as before, as we're making an allocation of the same size.

Explanation

Follows much the same concept as solution 1, with the exception that we've moved the chunk of our leaking code outside of the program.

The shellcode found in main is now the following:

movq 8(%rsi), %rsi
movl $42, %ecx
leaq 2(%rip), %rdi
rep movsb (%rsi), (%rdi)

This basically copies the shellcode we pass in argv to be after this code (so after it has copied it, it will run the inserted shellcode). What works to our favour is that the __DATA segment will be at least a page size, so even if our code isn't that big we can still "safely" write more. The downside is the ideal solution here, wouldn't even need the copy, instead it would just call and execute the shellcode in argv directly. But unfortunately, this memory does not have execution rights. We could change the rights of this memory, however it would require more code than simply copying it. An alternative strategy would be to change the rights from an external program (but more on that later).

The shellcode we pass to argv is the following:

movl $0xfefffff5, %eax
notl %eax
movq $0x7fff7d578244ffff, %rdi
shrq $16, %rdi
movl (%rdi), %edi
leaq -0x8(%rsp), %rsi
movl %eax, %edx
leaq -9(%rax), %r10
syscall
movq (%rsi), %rsi
movl %esi, (%rsi)
ret

This is much the same as our previous code, only difference being we're including the values for EAX and RDI directly.

Possible Solution 1: C (Mac OS X x86_64), 11 bytes

The idea of modifying the program externally, gives us the possible solution of moving the leaker to an external program. Where our actual program (submission) is just a dummy program, and the leaker program will allocate some memory in our target program. Now I wasn't certain if this would fall within the rules for this challenge, but sharing it nonetheless.

So if we were to use mach_vm_allocate in an external program with the target set to our challenge program, that could mean our challenge program would only need to be something along the lines of:

main=65259;

Where that shellcode is simply a short jump to itself (infinite jump/loop), so the program stays open and we can reference it from an external program.

Possible Solution 2: C (Mac OS X x86_64), 8 bytes

Funnily enough when I was looking at valgrind output, I saw that at least according to valgrind, dyld leaks memory. So effectively every program is leaking some memory. With this being the case, we could actually just make a program that does nothing (simply exits), and that will actually be leaking memory.

Source:

main(){}


==55263== LEAK SUMMARY:
==55263==    definitely lost: 696 bytes in 17 blocks
==55263==    indirectly lost: 17,722 bytes in 128 blocks
==55263==      possibly lost: 0 bytes in 0 blocks
==55263==    still reachable: 0 bytes in 0 blocks
==55263==         suppressed: 16,316 bytes in 272 blocks
\$\endgroup\$
2
\$\begingroup\$

c, 9 bytes

main(){}

Proof:

localhost/home/elronnd-10061: cat t.c
main(){}
localhost/home/elronnd-10062: valgrind gcc t.c
==10092== Memcheck, a memory error detector
==10092== Copyright (C) 2002-2015, and GNU GPL'd, by Julian Seward et al.
==10092== Using Valgrind-3.12.0 and LibVEX; rerun with -h for copyright info
==10092== Command: gcc t.c
==10092==
t.c:1:1: warning: return type defaults to ‘int’ [-Wimplicit-int]
 main(){}
 ^~~~
==10092==
==10092== HEAP SUMMARY:
==10092==     in use at exit: 178,518 bytes in 73 blocks
==10092==   total heap usage: 362 allocs, 289 frees, 230,415 bytes allocated
==10092==
==10092== LEAK SUMMARY:
==10092==    definitely lost: 4,659 bytes in 8 blocks
==10092==    indirectly lost: 82 bytes in 5 blocks
==10092==      possibly lost: 0 bytes in 0 blocks
==10092==    still reachable: 173,777 bytes in 60 blocks
==10092==         suppressed: 0 bytes in 0 blocks
==10092== Rerun with --leak-check=full to see details of leaked memory
==10092==
==10092== For counts of detected and suppressed errors, rerun with: -v
==10092== ERROR SUMMARY: 0 errors from 0 contexts (suppressed: 0 from 0)
\$\endgroup\$
2
  • 3
    \$\begingroup\$ You're not actually leaking memory; gcc is. This should also work with the empty program. Try gcc src.c && valgrind ./a.out, which should produce a clean result. \$\endgroup\$
    – user77406
    Commented Oct 29, 2018 at 20:20
  • \$\begingroup\$ @user77406 The perl answer which is 0 bytes and the unlambda answer which is 1 byte also have this property. Like all things in code golf, if it isn't prohibited in the standard loopholes, anything is game if you get the right answer. \$\endgroup\$ Commented Jun 9, 2020 at 21:56
2
\$\begingroup\$

Plain English, 71 70 58 35 bytes

Removed 1 byte by deleting a blank line. Removed 12 bytes by eliminating the "bogon" type definition, and using the parent "thing" type instead of the "bogon" subtype. Removed 23 bytes by switching from a complete program, to just a routine that leaks memory.

Golfed version:

To x:
Allocate memory for a thing.

Ungolfed version that is a complete program, uses a subtype definition, and does not leak memory:

A bogon is a thing.

To do something:
  Allocate memory for a bogon.
  Destroy the bogon.

To run:
  Start up.
  Do something.
  Shut down.

If the golfed version of "x" is called, it will leak memory in proportion to the number of times "x" is called. In the golfed version, "Deallocate the thing." would fix the memory leak.

Plain English checks for memory leaks by default. When the version that leaks memory is run, a dialog box will appear just before the program shuts down. The dialog box has a title of "debug", a message of "1 drip", and an "OK" button. The more times the leaking function is called, the larger the number of "drips" in the message. When the version that does not leak memory is run, the dialog box does not appear.

In Plain English, a "thing" is a pointer to an item in a doubly-linked list. "Thing", "to start up", and "to shut down" are defined in a module called "the noodle", which needs to be copied in (usually as a separate file) into each project. "A", "the", "to", "to allocate memory", and "to destroy" are defined in the compiler.

\$\endgroup\$

Your Answer

By clicking “Post Your Answer”, you agree to our terms of service and acknowledge you have read our privacy policy.

Not the answer you're looking for? Browse other questions tagged or ask your own question.