Tweeted twitter.com/#!/StackCodeGolf/status/568095031074168832
Added heatmap images
Source Link
Logic Knight
  • 6.8k
  • 1
  • 18
  • 50

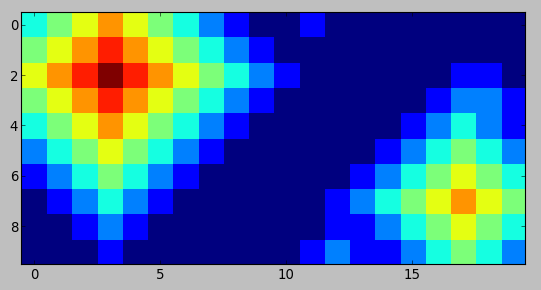
In graphical form this might look like:

heatmap of 9 sources

From the gradient, we can infer the positions and intensities of some heat sources, but not all. For example, all 9s can always be inferred, since they have the maximal temperature, and so can the 8 in this case, since it produces a local maximum in the gradient. The 2 near the right border can also be inferred, even though it is not at a local maximum, since it does not have another 2 as a neighbor. The 5s, on the other hand, are not inferred, since their heat might as well be produced by the more intense sources near them. The 0s are known to contain no heat sources, but all the other tiles may potentially contain one. Let's denote the uncertain tiles by hyphens -, certain heat sources by the corresponding digits, and certain empty space by periods .:

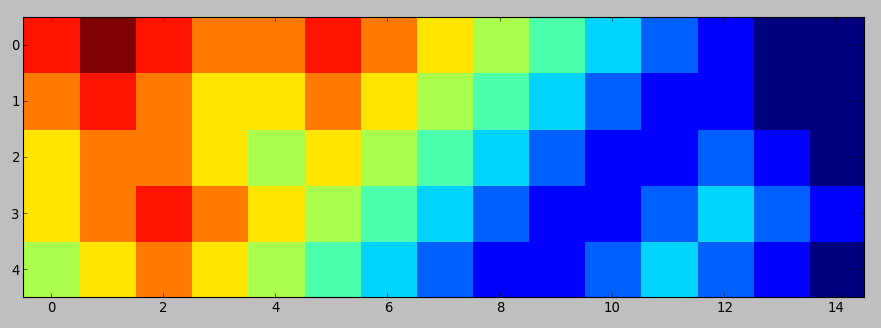
which looks like this in graphical form:

test case 1

From the gradient, we can infer the positions and intensities of some heat sources, but not all. For example, all 9s can always be inferred, since they have the maximal temperature, and so can the 8 in this case, since it produces a local maximum in the gradient. The 2 near the right border can also be inferred, even though it is not at a local maximum, since it does not have another 2 as a neighbor. The 5s, on the other hand, are not inferred, since their heat might as well be produced by the more intense sources near them. The 0s are known to contain no heat sources, but all the other tiles may potentially contain one. Let's denote the uncertain tiles by hyphens -, certain heat sources by the corresponding digits, and certain empty space by periods .:

In graphical form this might look like:

heatmap of 9 sources

From the gradient, we can infer the positions and intensities of some heat sources, but not all. For example, all 9s can always be inferred, since they have the maximal temperature, and so can the 8 in this case, since it produces a local maximum in the gradient. The 2 near the right border can also be inferred, even though it is not at a local maximum, since it does not have another 2 as a neighbor. The 5s, on the other hand, are not inferred, since their heat might as well be produced by the more intense sources near them. The 0s are known to contain no heat sources, but all the other tiles may potentially contain one. Let's denote the uncertain tiles by hyphens -, certain heat sources by the corresponding digits, and certain empty space by periods .:

which looks like this in graphical form:

test case 1

Source Link
Zgarb
  • 42.8k
  • 4
  • 79
  • 259

Decode a Heat Map

Heatmaps

Consider a rectangular room, on whose ceiling we have a thermal camera pointing downward. In the room, there are some number of heat sources of intensity 1-9, the background temperature being 0. The heat dissipates from each source, dropping by one unit per (non-diagonal) step. For example, the 20x10 room

...........1........
....................
...8................
..5...............2.
....................
.1..................
................1...
.................65.
....................
............2.......

contains 9 heat sources, and the temperature gradient shown by the thermal camera is

34565432100100000000
45676543210000000000
56787654321000000110
45676543210000001221
34565432100000012321
23454321000000123432
12343210000001234543
01232100000012345654
00121000000011234543
00010000000121123432

From the gradient, we can infer the positions and intensities of some heat sources, but not all. For example, all 9s can always be inferred, since they have the maximal temperature, and so can the 8 in this case, since it produces a local maximum in the gradient. The 2 near the right border can also be inferred, even though it is not at a local maximum, since it does not have another 2 as a neighbor. The 5s, on the other hand, are not inferred, since their heat might as well be produced by the more intense sources near them. The 0s are known to contain no heat sources, but all the other tiles may potentially contain one. Let's denote the uncertain tiles by hyphens -, certain heat sources by the corresponding digits, and certain empty space by periods .:

---------..1........
----------..........
---8-------......--.
----------......--2-
---------......-----
--------......------
-------......-------
.-----......-----6--
..---.......--------
...-.......-2-------

Your task shall be to produce this inferred pattern from the temperature gradient.

Rules

You are given the input as a string delimited by either newlines or vertical pipes |, whichever is more convenient, and the output shall be of the same form. There may be a trailing delimiter in the input and/or output, but no preceding one. The size of the input may vary, but its width and height are always at least 4. Both functions and full programs are acceptable. The lowest byte count wins, and standard loopholes are forbidden.

Additional Test Cases

Input:

898778765432100
787667654321100
677656543211210
678765432112321
567654321123210

Output:

-9---8-------..
-------------..
--------------.
--8---------3--
-----------3--.

Input:

7898
8787
7676
6565

Output:

--9-
8---
----
----

Input:

00001
00000
00000
10000

Output:

....1
.....
.....
1....