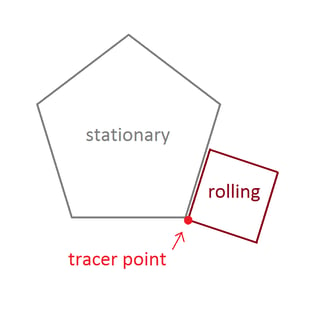
An epicycloid is the curve a point on a circle makes as it rolls around another circle. A cyclogon is the shape a point on a regular polygon makes as it rolls across a plane. An epicyclogon is the curve traced by a point on one regular polygon as it rolls around another.
Write a program that draws an epicyclogon given r, r1, r2, n1, n2:
r = number of clockwise revolutions rolling polygon makes around stationary polygon (any real number as limited by float values)
r1 = distance from center of stationary polygon to each of its vertices (positive real number)
r2 = distance from center of rolling polygon to each of its vertices (positive real number)
n1 = number of sides stationary polygon has (integer greater than 2)
n2 = number of sides rolling polygon has (integer greater than 2)
Notes
- When
ris negative the roller should go counterclockwise. - For
r, one revolution occurs when the line connecting the centroids of the two shapes sweeps out a full 360 degrees. This notion is expanded to include all values ofr. (So in a quarter revolution the line connecting the centroids sweeps out 90 degrees.) - These arguments should come from the command line or your program should prompt for them (e.g. with Python's
input()). r1andr2are relative to each other, not the dimensions of the image. So you can set one "unit" to be any number of actual pixels.
The point you must trace out is one of the vertices of the rolling shape. The shapes must start with this vertex touching a stationary vertex and two sides adjacent:

The exact starting vertices and the angle of the stationary polygon do not matter.
Output
The output should go to an image that is at least 600x600 pixels (or some variable dimension than can be set to 600). It must show the entire epicyclogon curve specified by the parameters, well framed in the image.
The rolling and stationary polygons must also be drawn (with the roller in it's final state). The two shapes and the epicyclogon should be three noticeably different colors.
There must also be a simple way to not draw the polygons (a change of true to false in the code suffices).
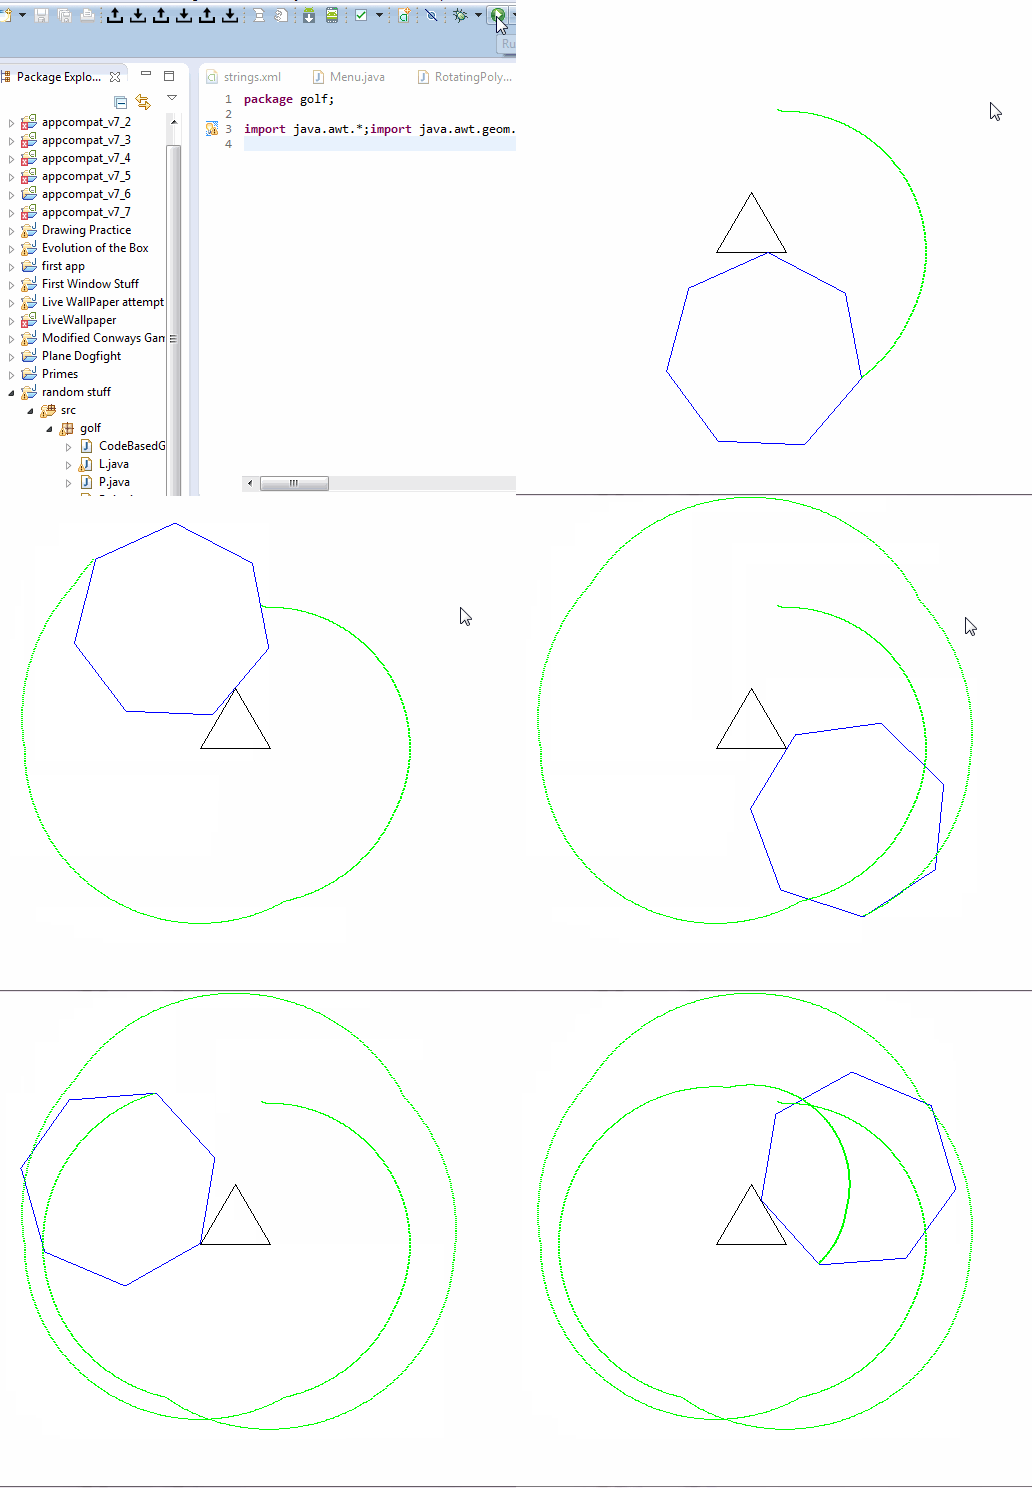
Please show us at least 2 output images. It's ok to shrink them if necessary.
Scoring
The shortest code that produces valid output images wins.
Bonuses
- Minus 50 bytes if the output is an animated gif (or similar) of the curve being drawn.
- Minus 150 bytes if you let
n1andn2take the value 2 so the shapes become line segments of length2 * r1(orr2), "rolling" around each other. How you handlerwhenn1andn2are 2 is up to you since the centroids don't revolve around each other the way they do in other cases. (Not "rolling" at all does not count as handling it.)
Since I am quite eager to see this novel idea executed well (and it's not exactly a cakewalk), I am going to award 150 bounty rep to the winner. The contest will end the same day the bounty runs out.
The bounty will not be awarded to the winner if it is clear that they simply rewrote most of the code from another submission.
Library functions that already happen to do this (if there are any) are not allowed.
Note: This came from my leftover questions that anyone is free to post. But if no one else posts them there's a good chance I will in time. :P


