15
\$\begingroup\$

I read about circles somewhere, and just now learned about discs (it's actually a pretty common concept) and thought about codegolf.

Your task is to randomize a point/several points on a disc with the radius 1.

Rules:

  • All points must have an equal probability to be generated
  • Floating point coordinates must be used; the minimum requirement is two decimals (e.g. the points (0.12, -0.45) or (0.00, -1.00) are valid)
  • You get -20 bytes if your program actually displays the bounding circle and the point(s) generated in it. Coordinates still has to be valid but not displayed, and the image generated has to be at least 201 by 201 pixels in size
  • You get -5 bytes if your program takes the number of points to be generated as input on stdin
  • If you decide not to plot the bounding circle and the point(s), your program has to output the point(s) generated on the format (x, y) or (x,y) on stdout
  • If you decide to take the number of generated points as input, but not to plot it - your program has to output all the randomized points on the format stated above with or without one space in between

Shortest submission in bytes wins!

\$\endgroup\$
12
  • 1
    \$\begingroup\$ @sweerpotato Yes, please specify that all the points in and on the circle are valid. I did not realize you meant both. Also, this question seems like it would fit a code-golf challenge better than a popularity-contest, but that's just my opinion. \$\endgroup\$
    – cole
    Commented Sep 6, 2015 at 16:59
  • 5
    \$\begingroup\$ "Do XYZ in a creative way" is the classic Bad Popcon Question™. What one person considers creative is what another person considers the obvious way. \$\endgroup\$ Commented Sep 6, 2015 at 17:01
  • \$\begingroup\$ Out of curiosity, why a 201x201 pixel output requirement for plots? \$\endgroup\$
    – JohnE
    Commented Sep 6, 2015 at 17:39
  • \$\begingroup\$ @JohnE I suggested 201x201 pixels as it matches the required 2 decimal place accuracy \$\endgroup\$ Commented Sep 6, 2015 at 17:39
  • \$\begingroup\$ May we output the coordinates as complex numbers? For example: 0.3503082505747327+0.13499221288682994j. \$\endgroup\$
    – orlp
    Commented Sep 6, 2015 at 18:00

18 Answers 18

16
\$\begingroup\$

CJam, 28 27 bytes

PP+mr_mc\ms]1.mrmqf*"(,)".\

This solution is not rejection-based. I'm generating the points in polar coordinates, but with a non-uniform distribution of the radii to achieve a uniform density of the points.

Test it here.

Explanation

PP+     e# Push 2π.
mr_     e# Get a random float between 0 and 2π, make a copy.
mc\     e# Take the cosine of one copy and swap with the other.
ms]     e# Take the sine of the other copy and wrap them in an array.
        e# This gives us a uniform point on the unit circle.
1.mr    e# Get a random float between 0 and 1.
mq      e# Take the square root. This is the random radius.
f*      e# Multiply x and y by this radius.
"(,)".\ e# Put the resulting numbers in the required format.

Why does it work? Consider a narrow annulus of radius r and (small) width dr. The area is approximately 2π*r*dr (if the annulus is narrow, the inner and outer circumference are almost identical, and the curvature can be ignored, such that the area can be treated as that of a rectangle with side lengths of the circumference and the width of the annulus). So the area increases linearly with the radius. This means that we also want a linear distribution of the random radii, in order to achieve a constant density (at twice the radius, there is twice as much area to fill, so we want twice as many points there).

How do we generate a linear random distribution from 0 to 1? Let's look at the discrete case first. Say, we have a desired distribution of 4 values, like {0.1, 0.4, 0.2, 0.3} (i.e. we want 1 to be 4 times as common as 0, and twice as common as 2; we want 3 three times as common as 0):
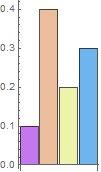
enter image description here

How can pick one of the four values with the desired distribution? We can stack them up, pick a uniformly random value between 0 and 1 on the y-axis and pick the segment at that point:
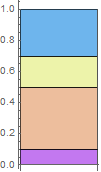
enter image description here

There's a different way to visualise this picking though. We could instead replace each value of the distribution with the accumulation of the values up to that point:
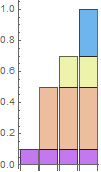
enter image description here

And now we treat the top line of this chart as a function f(x) = y and invert it to get a function g(y) = f-1(y) = x, which we can apply to a uniformly random value in y ∈ [0,1]:
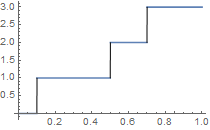
enter image description here

Cool, so how can make use of this to generate a linear distribution of radii? This is the distribution we want:
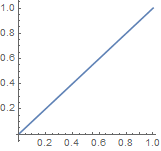
enter image description here

The first step is to accumulate the values of the distribution. But the distribution is continuous, so instead of summing over all previous values, we take an integral from 0 to r. We can easily solve that analytically: 0r r dr = 1/2 r2. However, we want this to be normalised, i.e. to multiply it by a constant such that this gives 1 for the maximum value of r, so what we really want is r2:
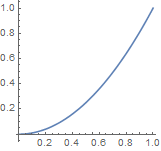
enter image description here

And finally, we invert this to get a function we can apply to a uniform value in [0,1], which we can again do analytically: it's just r = √y, where y is the random value:
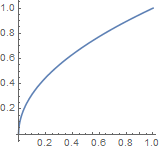
enter image description here

This is a fairly useful technique that can often be used to generate simple distributions exactly (it works for any distribution, but for complicated ones the last two steps may have to be solved numerically). However, I wouldn't use it in this particular case in production code, because the square root, sine and cosine are prohibitively expensive: using a rejection-based algorithm is on average much faster, because it only needs addition and multiplication.

\$\endgroup\$
2
  • 1
    \$\begingroup\$ Very nice explanation! \$\endgroup\$ Commented Sep 6, 2015 at 19:43
  • 2
    \$\begingroup\$ Mmm pictures :D \$\endgroup\$
    – Beta Decay
    Commented Sep 6, 2015 at 21:06
12
\$\begingroup\$

Mathematica, 68 44 - 20 = 24 bytes

Many thanks for David Carraher for letting me know about RandomPoint, which saved 24 (!) bytes. Mathematica does have a built-in for everything.

Graphics@{Circle[],Point@RandomPoint@Disk[]}

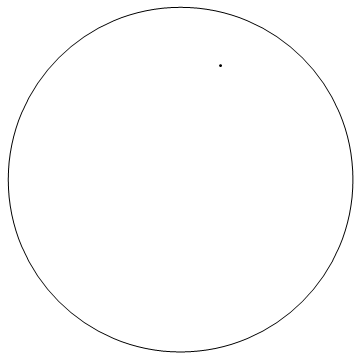
This plots the point and the bounding circle to qualify for the bonus:

enter image description here

The result is a vector image, so the size specification of 201x201 pixels doesn't really make sense, but by default it does render larger than that.

\$\endgroup\$
6
  • \$\begingroup\$ How about Graphics[{Circle[], Point@RandomPoint@Disk[]}] ? \$\endgroup\$
    – DavidC
    Commented Sep 6, 2015 at 19:18
  • \$\begingroup\$ Be my guest. Also, to save 1 byte...Graphics@{Circle[], Point@RandomPoint@Disk[]} \$\endgroup\$
    – DavidC
    Commented Sep 6, 2015 at 19:21
  • \$\begingroup\$ @DavidCarraher Thanks a lot! :) \$\endgroup\$ Commented Sep 6, 2015 at 19:31
  • \$\begingroup\$ I don't know Mathematica syntax but surely you can save another byte by removing the space after the ,? \$\endgroup\$
    – fluffy
    Commented Sep 7, 2015 at 5:39
  • \$\begingroup\$ @fluffy I already did in the posted version \$\endgroup\$ Commented Sep 7, 2015 at 6:11
9
\$\begingroup\$

CJam, 31 26 bytes

{];'({2dmr(_}2*@mhi}g',\')

This works by repeatedly generating random points in a square of side length 2 and keeping the first that falls inside the unit disc.

Thanks to @MartinBüttner for golfing off 3 bytes!

Try it online in the CJam interpreter.

How it works

{                  }g       Do:
 ];'(                         Clear the stack and push a left parenthesis.
     {      }2*               Do twice:
      2dmr                      Randomly select a Double between 0 and 2.
          (_                    Subtract 1 and push a copy.
               @              Rotate the copy of the first on top of the stack.
                mh            Compute the Euclidean norm of the vector consisting
                              of the two topmost Doubles on the stack.
                  i           Cast to integer.
                            If the result is non-zero, repeat the loop.
                     ',\    Insert a comma between the Doubles.
                        ')  Push a right parenthesis.
\$\endgroup\$
0
8
\$\begingroup\$

iKe, 53 51 bytes

Nothing particularly special, but I suppose we ought to have at least one graphical solution:

,(80+160*t@&{.5>%(x*x)+y*y}.+t:0N 2#-.5+?9999;cga;3)

plot

Try it in your browser.

Edit: I can shave off two bytes by applying @MartinBüttner's approach for modifying the distribution of polar coordinates. I think it's also quite a bit more direct:

,(80*1+(%?c){x*(cos y;sin y)}'6.282*?c:9999;cga;3)
\$\endgroup\$
2
  • 3
    \$\begingroup\$ If you'd also draw the bounding circle you'd qualify for -20. \$\endgroup\$
    – orlp
    Commented Sep 6, 2015 at 18:01
  • 1
    \$\begingroup\$ iKe has a raster-based drawing model, making that requirement rather unfair. I think it would cost quite a bit more than 20 characters to render an approximation of a bounding circle as well. \$\endgroup\$
    – JohnE
    Commented Sep 6, 2015 at 18:32
7
\$\begingroup\$

Perl, 59 Bytes

while(($x=1-rand 2)**2+($y=1-rand 2)**2>1){};print"($x,$y)"

This is just a simple solution, generating points in a square and rejecting those too far away. My singular golfing trick is to include the assignments inside of the condition.

Edit: In the process of golfing, I found an interesting way to print random points on a circle.

use Math::Trig;$_=rand 2*pi;print"(",sin,",",cos,")"
\$\endgroup\$
7
\$\begingroup\$

Octave, 24 53 - 20 = 33 bytes

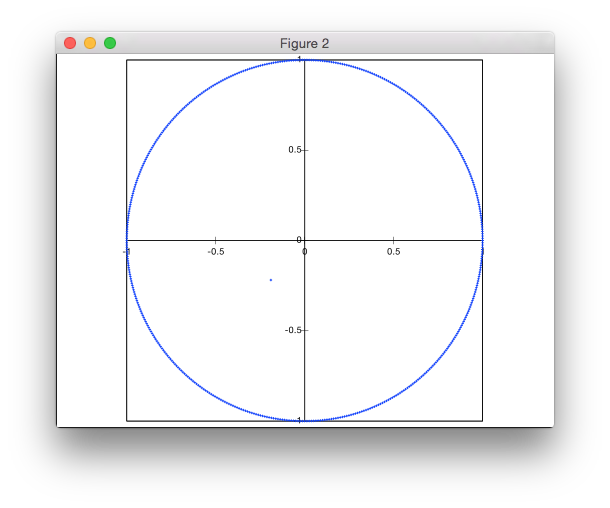
polar([0:2e-3:1,rand]*2*pi,[ones(1,501),rand^.5],'.')

Generates 501 equally-spaced theta values plus one random number and scales them all to [0..2π]. Then generates 501 1's for the radius of the circle, plus a random radius for the point and takes the square root to ensure uniform distribution over the disc. Then plots all the points as polar coordinates.

enter image description here


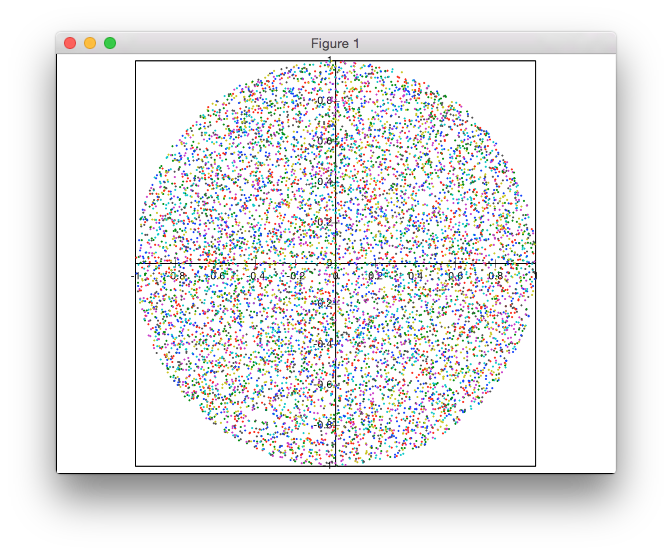
Here is a quick demonstration of the distribution (without the unit circle):

polar(2*pi*rand(99),rand(99).^.5,'.')

9801 Points

\$\endgroup\$
0
5
\$\begingroup\$

Pyth, 26 - 5 = 21 bytes

VQp(sJ*@OZ2^.n1*yOZ.l_1)eJ

Takes the number of coordinates to generate on stdin, and outputs them on stdout like such:

(-0.5260190768964058, -0.43631187015380823)(-0.12127959509302746, -0.08556306418467638)(-0.26813756369750996, -0.4564539715526493)

Uses a strategy similar to @MartinBüttner, generating polar coordinates and radii, except it does it using complex exponentiation.

\$\endgroup\$
3
  • \$\begingroup\$ You can remove the p, can't you? It just changes the output to separate lines. \$\endgroup\$ Commented Sep 7, 2015 at 9:00
  • \$\begingroup\$ @Pietu1998 That's not allowed, see the comments on the main question. \$\endgroup\$
    – orlp
    Commented Sep 7, 2015 at 9:06
  • \$\begingroup\$ Oh, a‍ll right. \$\endgroup\$ Commented Sep 7, 2015 at 9:07
5
\$\begingroup\$

Octave / Matlab, 74 64 bytes

Rejection method, 64 bytes:

u=1;v=1;while u^2+v^2>1
u=rand;v=rand;end
sprintf('(%f,%f)',u,v)

Direct method, 74 bytes (thanks to Martin Büttner for helping me correct two errors):

t=rand*2*pi;r=1-abs(1-sum(rand(2,1)));sprintf('(%f,%f)',r*cos(t),r*sin(t))
\$\endgroup\$
0
5
\$\begingroup\$

R, 99 95 81-20 = 79 75 61 Bytes

symbols(0,0,1,i=F,asp=1,ylim=c(-1,1));points(complex(,,,runif(9),runif(9,-1)*pi))

Use the complex number construction to build the x/y's from polar coordinates. Taking the input was a bit expensive and there is probably a better way to do this. The ylim and xlim is to ensure the entire circle is plotted and the asp ensures the points are shown under the circle symbol.

Thanks to @jbaums and @flodel for the savings

Try it here

\$\endgroup\$
5
  • \$\begingroup\$ runif(9,0,1) can be simplified to runif(9) \$\endgroup\$
    – jbaums
    Commented Sep 6, 2015 at 20:58
  • \$\begingroup\$ @jbaums, thanks ... one of things that I always seem to forget:) \$\endgroup\$
    – MickyT
    Commented Sep 6, 2015 at 21:37
  • \$\begingroup\$ Can shave 14: symbols(0,0,1,i=F,asp=1,ylim=c(-1,1));points(complex(,,,runif(9),runif(9,-1)*pi)) \$\endgroup\$
    – flodel
    Commented Sep 6, 2015 at 22:07
  • \$\begingroup\$ @flodel very nice thank you. \$\endgroup\$
    – MickyT
    Commented Sep 6, 2015 at 22:51
  • \$\begingroup\$ Another teeny saving: yli works in place of ylim. \$\endgroup\$
    – jbaums
    Commented Sep 8, 2015 at 7:24
4
\$\begingroup\$

Processing /Java 141 bytes-20=121

the requirement for 201*201 being the minimum size requires me to put in the setup method since Processing.org defaults to 200x200 :(

void setup(){noFill();size(201,201);}void draw(){float f=10,a=PI*2*random(),r=random();point(f+f*sin(a)*r,f+f*cos(a)*r);ellipse(f,f,f*2,f*2)}
\$\endgroup\$
1
  • \$\begingroup\$ I didn't know processing/java was allowed, neat! \$\endgroup\$
    – J Atkin
    Commented Sep 9, 2015 at 12:42
4
\$\begingroup\$

QBasic, 138 bytes - 20 - 5 = 113

INPUT n
r=200
SCREEN 12
RANDOMIZE TIMER
CIRCLE(r,r),r
PAINT(r,r)
FOR i=1TO n
DO
x=RND*r*2
y=RND*r*2
LOOP UNTIL POINT(x,y)
PSET(x,y),1
NEXT

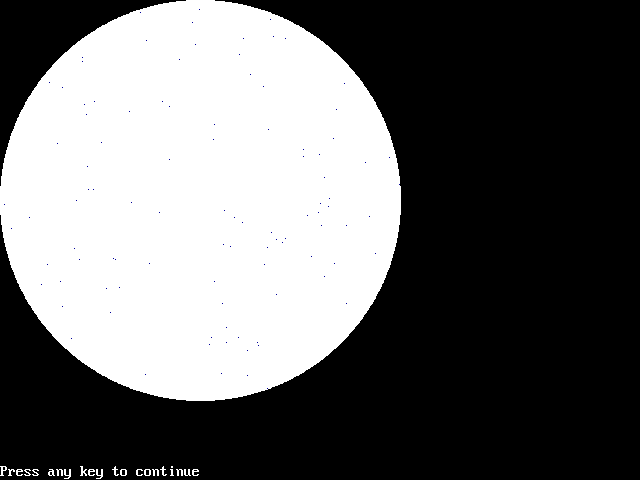
Takes user input and draws the disc and points. Tested on QB64.

This is a pretty basic "throw at the dartboard and keep what sticks" strategy. The catch is that "what sticks" is not determined mathematically but graphically: a white disc is plotted on a black background, and then randomly generated points are rejected until they are not black. The points themselves are drawn in blue (though it's hard to tell when they're single pixels--click on the image to enlarge).

\$\endgroup\$
3
\$\begingroup\$

awk - 95 - 5 = 90

{
    for(;$1--;printf"("(rand()<.5?x:-x)","(rand()<.5?y:-y)")")
        while(1<(x=rand())^2+(y=rand())^2);
}

Since i wasn't quite sure about the rand()<.5 part, I did some distribution testing with this, using this script:

BEGIN{ srand() }
{ 
    split("0 0 0 0", s)
    split("0 0 0 0", a)

    for(i=$1; i--; )
    {
        while( 1 < r2 = ( x=rand() )^2 + ( y=rand() )^2 );

        x = rand()<.5 ? x : -x
        y = rand()<.5 ? y : -y

        ++s[ x>=0 ? y>=0 ? 1 : 4 : y>=0 ? 2 : 3 ]

        ++a[ r2>.75 ? 1 : r2>.5 ? 2 : r2>.25 ? 3 : 4]
    }

    print "sector distribution:"
        for(i in s) print "sector " i ": " s[i]/$1

    print "quarter area distribution:"
        for(i in a) print "ring " i ":   " a[i]/$1
}

which for an input of 1e7 gives me this result, after I sipped once or twice at my coffee:

1e7
sector distribution:
sector 1: 0.250167
sector 2: 0.249921
sector 3: 0.249964
sector 4: 0.249948
quarter area distribution:
ring 1:   0.24996
ring 2:   0.25002
ring 3:   0.250071
ring 4:   0.249949

which I think is quite alright.

A little explanation:
After scribbling about for a while it turned out, that if you want to divide the disc into four rings with equal area, the radii where you would have to cut are sqrt(1/4), sqrt(1/2) and sqrt(3/4). Since the actual radius of the point I test would be sqrt( x^2 + y^2), I can skip the square rooting all together. The 1/4, 2/4, 3/4 "coincidence" might be related to what M. Buettner pointed out earlier.

\$\endgroup\$
3
\$\begingroup\$

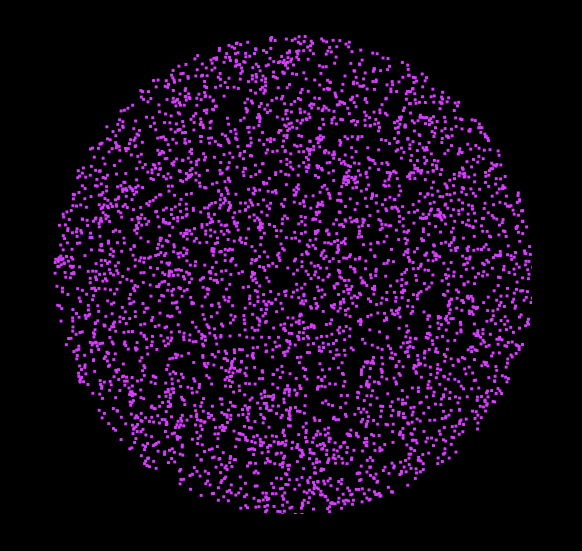
HPPPL, 146 (171-20-5) bytes

EXPORT r(n)BEGIN LOCAL R,A,i,Q;RECT();Q:=118.;ARC_P(Q,Q,Q);FOR i FROM 1 TO n DO R:=√RANDOM(1.);A:=RANDOM(2*π);PIXON_P(G0,IP(Q+Q*R*COS(A)),IP(Q+Q*R*SIN(A)));END;FREEZE;END;

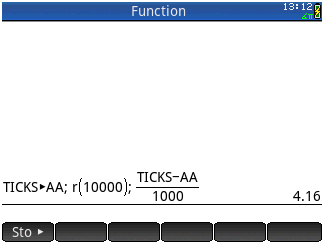
Example for 10000 points (including timing in seconds for the real device):

Randomize points on a disc, timing

The function itself is called by r(n). The rest in the image above is only for timing purposes.

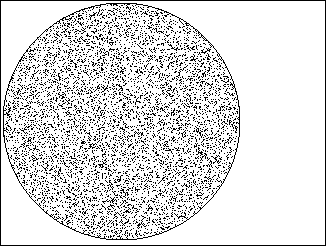
Result (disc diameter is 236 pixels):

enter image description here

The version above does not store the point coordinates, so I wrote a version that takes two parameters r(n,p). n is the number of points and p=0 returns the points to the terminal, p=1 plots the points and the disc), in case storing coordinates is mandatory. This version is 283 (308-20-5) bytes long:

EXPORT r(n,p)BEGIN LOCAL R,A,j,Q,x,y;Q:=118.0;CASE IF p==0 THEN print() END IF p==1 THEN RECT();ARC_P(Q,Q,Q) END END;FOR j FROM 1 TO n DO R:=√RANDOM(1.0);A:=RANDOM(2*π);x:=R*COS(A);y:=R*SIN(A);CASE IF p==0 THEN print("("+x+", "+y+")") END IF p==1 THEN PIXON_P(G0,IP(Q+Q*x),IP(Q+Q*y)) END END;END;FREEZE;END;

The ungolfed version:

EXPORT r(n,p)
BEGIN
LOCAL R,A,j,Q,x,y;
  Q:=118.0;
  CASE
    IF p==0 THEN print() END
    IF p==1 THEN RECT();ARC_P(Q,Q,Q) END
  END;
  FOR j FROM 1 TO n DO
    R:=√RANDOM(1.0);
    A:=RANDOM(2*π);
    x:=R*COS(A);
    y:=R*SIN(A);
    CASE
      IF p==0 THEN print("("+x+", "+y+")") END
      IF p==1 THEN PIXON_P(G0,IP(Q+Q*x),IP(Q+Q*y)) END
    END;
  END;
  FREEZE;
END;

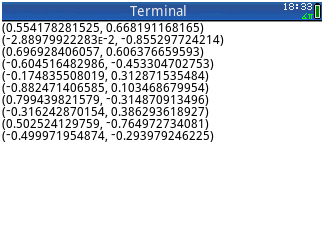
Terminal output for r(10,0):

Randomize points on a disc terminal output

r(10,1) shows the disc with the points, like shown above.

\$\endgroup\$
2
\$\begingroup\$

JavaScript, 75 bytes

Rejection-based:

do x=(r=()=>4*Math.random()-2)(),y=r()
while(x*x+y*y>1)
alert(`(${[x,y]})`)

Direct method (80 bytes):

alert(`(${[(z=(m=Math).sqrt((r=m.random)()))*m.sin(p=m.PI*2*r()),z*m.cos(p)]})`)
\$\endgroup\$
2
\$\begingroup\$

Python, 135 130 bytes

from random import*
def r():return uniform(-1,1)
p=[]
while not p:
    x,y=r(),r()
    if x**2+y**2<=1:p=x,y
print'(%.2f, %2f)'%p

Removed the **0.5 thanks to @jimmy23013’s suggestion (because it is a unit circle, I am now checking whether the distance squared between (x, y) and (0, 0) is equal to 12. This is the same thing).

This also freed me to remove the parentheses.

\$\endgroup\$
3
  • \$\begingroup\$ I think you don't need the **0.5. \$\endgroup\$
    – jimmy23013
    Commented Sep 8, 2015 at 13:19
  • \$\begingroup\$ @jimmy23013 Thank you! removed. \$\endgroup\$
    – J F
    Commented Sep 8, 2015 at 14:25
  • \$\begingroup\$ uniform(-1,1) can be replaced with random()*2-1 to save 1 byte. You can also change def r():return uniform(-1,1) with r=lambda:uniform(-1,1) to save 6 bytes. Merging these together, def r():return uniform(-1,1) can be changed to r=lambda:random()*2-1 to save 7 bytes. x**2+y**2 can be reduced to x*x+y*y to save 2 bytes. It also seems you can change (%.2f, %2f) to %f,%f to save 6 bytes. Try It Online on TIO!. \$\endgroup\$ Commented May 20, 2023 at 17:07
1
\$\begingroup\$

Python 3.8 (pre-release), 82 79 78 Bytes

from random import*
r=random
while(x:=r()*2-1)*x+(y:=r()*2-1)*y>1:1
print(x,y)

-3 from TheThonnu by murdering whitespace and exponents.

-1 from TheThonnu by showing that you can change function names by variable assignment.

Verify that it actually works by running on TIO.

Walrus returns and assigns at the same time.

The walrus likes to assign variables and return their value at the same time, and I don't understand why...

\$\endgroup\$
3
  • \$\begingroup\$ 79 bytes \$\endgroup\$
    – The Thonnu
    Commented May 20, 2023 at 15:57
  • \$\begingroup\$ 78 bytes \$\endgroup\$
    – The Thonnu
    Commented May 20, 2023 at 18:53
  • \$\begingroup\$ @TheThonnu a newline takes the same amount of bytes as a semicolon, so it doesn’t really matter which one you use. I also changed the capital R to a lowercase one. \$\endgroup\$ Commented May 21, 2023 at 8:39
0
\$\begingroup\$

Desmos, 52 - 20 = 32 Bytes

r=1
a=1
b=1
(acosb,asinb)
a->random(),b->2πrandom()

I’ve never golfed in Desmos before. Click the bottom action to generate a random point. Try prettified version online. If anyone knows a shorter way to graph a polar coordinate point, please tell me, since I’m unaware of any builtin to graph a point in polar coordinates.

\$\endgroup\$
0
\$\begingroup\$

Befunge-with-graphics, 224 212 bytes (237 before deductions)

Takes input from stdin, draws image to the screen.

>99*3*:s000fc88*3*::f765+jv
v1j0-10::*:+29p02j50p01j50<
>0g29+:*-:*20g92+:*-:*+v
v:-1xg02g01_v#!`*:*:+92<
>!#v_       >94+2*1j
v
0vu<
6>z:1-#v_@
#^$$$$$<
>$$99*3*%r
0
|!:-1\<>0>~:52*-   #v_$r
\  > v*  ^+**25\-"0"<
>#v?v 4
  0123+
  >>>>^

Explanation

Random coordinates are generated using the ? operator, to build a large random number. Each of the 4 directions the ? operator could go adds a new digit to a base-4 number which is then eventually modulo'd by the screen width to get a random coordinate on the screen. (bottom-most bit)

The distance from the centre of the circle is then calculated, and if it's outside the circle it generates a new pair of coordinates. Else, it draws a pixel and repeats, decrementing a counter. (top block of stuff)

Finally, the screen is updated and events are handled. (bit with all the $$$$s)

Circle with 10 points (to verify there are actually 10):
10 points

Circle with 10000 points:
10000 points

I'm not certain this counts because of many factors

  • Befunge-with-graphics is my "made up" language, but it predates my knowledge of this question.
  • Since befunge doesn't support floating point, all coordinates are in pixels and may not have the required precision. The image, however, is greater than 201x201 pixels in size.
  • Technically no points can appear directly on the edge of the circle.
\$\endgroup\$

Your Answer

By clicking “Post Your Answer”, you agree to our terms of service and acknowledge you have read our privacy policy.

Not the answer you're looking for? Browse other questions tagged or ask your own question.