added 34 characters in body
Source Link
plannapus
  • 9k
  • 22
  • 47
par(mar=rep(0,4))
plot(NA,xlim=c(0,9),ylim=c(0,3)) #Create empty plot: due to fuzzy matching of arguments, xlim can be reduced to xli
N=list(array(c(0,3,3,2,2,0,0,0,0,1,1,3,3,0),dim=c(7,2)), #C polygon
       array(c(3,6,6,5,5,4,4,3,3,0,0,1,1,3,3,1,1,0),dim=c(9,2)), #D polygon
       array(c(6,6,7,7,9,9,6,0,1,1,3,3,0,0),dim=c(7,2)), #E polygon
       array(c(2,4,4,2,2,1,1,3,3,1),dim=(5,2)), #Db polygon
       array(c(5,7,7,5,5,1,1,3,3,1),dim=(5,2)))  #Eb polygon
c=c(NA,NA,NA,1,1) #Colors: by default 1 is "black"
for(i in 1:5){polygon(N[[i]],color=c[i])}
h=c(261.63,293.66,329.63,277.18,311.13) #Notes frequency in hertz: C4, D4, E4, Db4 and Eb4
library(tuneR)
setWavPlayer("~/Library/Audio/playRwave") #This can be change to other wav player I think
repeat{
    P=data.frame(locator(1)) #Grab coordinates of selected point
    H=h[sapply(N,function(x)splancs::inout(P,x))] #In which polygon does the selected point belong to, then map it to its ferquency
    s=sine(H,bit=16) #By default create a 1sec note at the given frequency with 44100 sampling rate
    play(s)
    }
par(mar=rep(0,4))
plot(NA,xlim=c(0,9),ylim=c(0,3)) #Create empty plot: due to fuzzy matching of arguments, xlim can be reduced to xli
N=list(array(c(0,3,3,2,2,0,0,0,0,1,1,3,3,0),dim=c(7,2)), #C polygon
       array(c(3,6,6,5,5,4,4,3,3,0,0,1,1,3,3,1,1,0),dim=c(9,2)), #D polygon
       array(c(6,6,7,7,9,9,6,0,1,1,3,3,0,0),dim=c(7,2)), #E polygon
       array(c(2,4,4,2,2,1,1,3,3,1),dim=(5,2)), #Db polygon
       array(c(5,7,7,5,5,1,1,3,3,1),dim=(5,2)))  #Eb polygon
c=c(NA,NA,NA,1,1) #Colors: by default 1 is "black"
for(i in 1:5){polygon(N[[i]],color=c[i])}
h=c(261.63,293.66,329.63,277.18,311.13) #Notes frequency
library(tuneR)
setWavPlayer("~/Library/Audio/playRwave") #This can be change to other wav player I think
repeat{
    P=data.frame(locator(1)) #Grab coordinates of selected point
    H=h[sapply(N,function(x)splancs::inout(P,x))] #In which polygon does the selected point belong to, then map it to its ferquency
    s=sine(H,bit=16) #By default create a 1sec note at the given frequency with 44100 sampling rate
    play(s)
    }
par(mar=rep(0,4))
plot(NA,xlim=c(0,9),ylim=c(0,3)) #Create empty plot: due to fuzzy matching of arguments, xlim can be reduced to xli
N=list(array(c(0,3,3,2,2,0,0,0,0,1,1,3,3,0),dim=c(7,2)), #C polygon
       array(c(3,6,6,5,5,4,4,3,3,0,0,1,1,3,3,1,1,0),dim=c(9,2)), #D polygon
       array(c(6,6,7,7,9,9,6,0,1,1,3,3,0,0),dim=c(7,2)), #E polygon
       array(c(2,4,4,2,2,1,1,3,3,1),dim=(5,2)), #Db polygon
       array(c(5,7,7,5,5,1,1,3,3,1),dim=(5,2)))  #Eb polygon
c=c(NA,NA,NA,1,1) #Colors: by default 1 is "black"
for(i in 1:5){polygon(N[[i]],color=c[i])}
h=c(261.63,293.66,329.63,277.18,311.13) #Notes frequency in hertz: C4, D4, E4, Db4 and Eb4
library(tuneR)
setWavPlayer("~/Library/Audio/playRwave") #This can be change to other wav player I think
repeat{
    P=data.frame(locator(1)) #Grab coordinates of selected point
    H=h[sapply(N,function(x)splancs::inout(P,x))] #In which polygon does the selected point belong to, then map it to its ferquency
    s=sine(H,bit=16) #By default create a 1sec note at the given frequency with 44100 sampling rate
    play(s)
    }
Source Link
plannapus
  • 9k
  • 22
  • 47

R - 491 characters

I'm a little late but I just saw this post yesterday.

Works on a Mac, uses playRWave and packages tuneR and splancs.

a=array
x=c(7,2)
y=c(5,2)
z=c(1,1,3,3)
par(mar=rep(0,4))
plot(NA,xli=c(0,9),yli=c(0,3))
N=list(a(c(0,3,3,2,2,0,0,0,0,z,0),x),a(c(3,6,6,5,5,4,4,3,3,0,0,z,1,1,0),c(9,2)),a(c(6,6,7,7,9,9,6,0,z,0,0),x),a(c(2,4,4,2,2,z,1),y),a(c(5,7,7,5,5,z,1),y))
c=c(NA,NA,NA,1,1)
for(i in 1:5){polygon(N[[i]],c=c[i])}
h=c(261.63,293.66,329.63,277.18,311.13)
library(tuneR)
setWavPlayer("~/Library/Audio/playRwave")
repeat{P=data.frame(locator(1));play(sine(h[sapply(N,function(x)splancs::inout(P,x))],bit=16))}
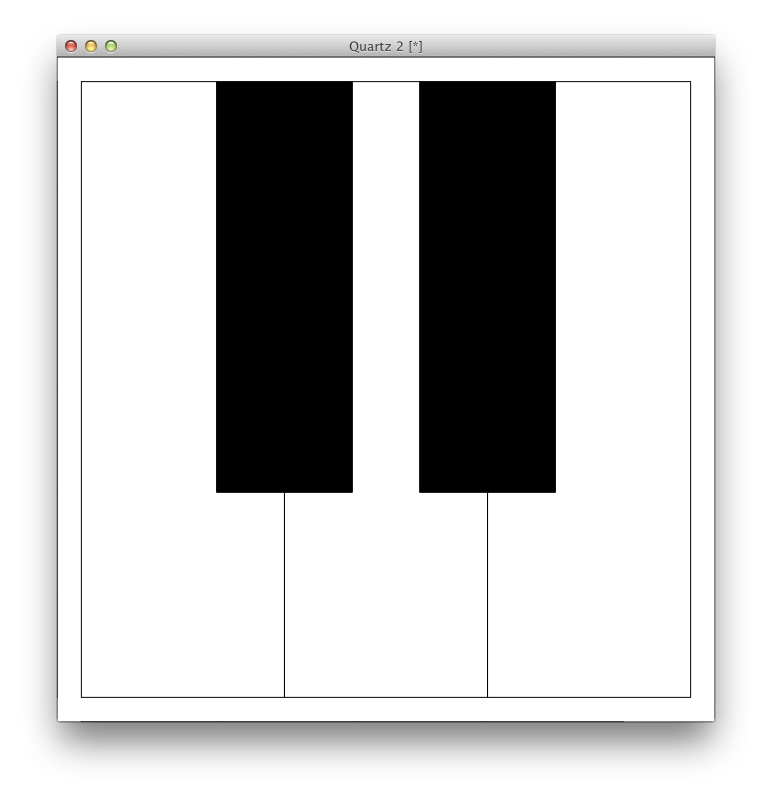
enter image description here

Ungolfed:

par(mar=rep(0,4))
plot(NA,xlim=c(0,9),ylim=c(0,3)) #Create empty plot: due to fuzzy matching of arguments, xlim can be reduced to xli
N=list(array(c(0,3,3,2,2,0,0,0,0,1,1,3,3,0),dim=c(7,2)), #C polygon
       array(c(3,6,6,5,5,4,4,3,3,0,0,1,1,3,3,1,1,0),dim=c(9,2)), #D polygon
       array(c(6,6,7,7,9,9,6,0,1,1,3,3,0,0),dim=c(7,2)), #E polygon
       array(c(2,4,4,2,2,1,1,3,3,1),dim=(5,2)), #Db polygon
       array(c(5,7,7,5,5,1,1,3,3,1),dim=(5,2)))  #Eb polygon
c=c(NA,NA,NA,1,1) #Colors: by default 1 is "black"
for(i in 1:5){polygon(N[[i]],color=c[i])}
h=c(261.63,293.66,329.63,277.18,311.13) #Notes frequency
library(tuneR)
setWavPlayer("~/Library/Audio/playRwave") #This can be change to other wav player I think
repeat{
    P=data.frame(locator(1)) #Grab coordinates of selected point
    H=h[sapply(N,function(x)splancs::inout(P,x))] #In which polygon does the selected point belong to, then map it to its ferquency
    s=sine(H,bit=16) #By default create a 1sec note at the given frequency with 44100 sampling rate
    play(s)
    }